Author’s note: This is interestingly one of the most popular pieces on my blog, but it is one of my earliest and one that I’m least happy with. As my understanding of data science has evolved, I’ve come to see it as less nuanced than my later work. I initially approached the subject from a systems dynamics standpoint, while now I approach it with supervised statistical learning. While I still think the fundamental truths behind the post are valid, I’ve revised it to reflect my current understanding. The original blogpost is HERE.
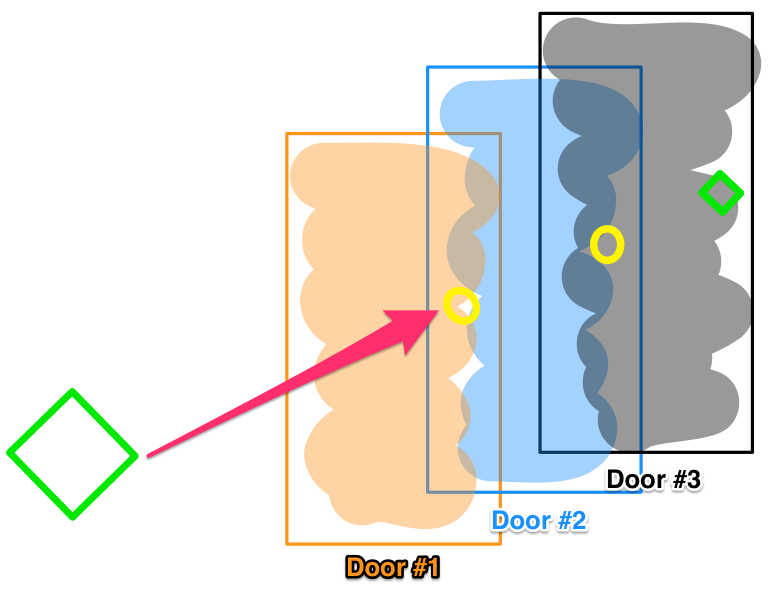
Why is this the case? As physicians, we often seek a “silver bullet” – a single, effective solution with no side effects. The simplicity of Occam’s razor is alluring. One drug, one cure. The key fits the lock and opens the door. Penicillin cures Syphilis. But what if things are not that simple? What if treating some diseases is more like navigating a series of locked doors? A potential treatment may be blocked by the body’s own systems, such as drug elimination or homeostatic mechanisms. This complexity is often overlooked in experimental design, and it could be leading to a gap between in vitro success and in vivo applicability.
www.n2value.com
Let’s consider a locked door pathway, where opening Door #1 lets you pass through to Door #2, and so on sequentially to a final Door #3. Now imagine a drug that easily unlocks Door #3 , and effects a robust treatment, when tested in vitro. But in actual patients, systemic complexities block that drug from ever reaching Door #3. This is an oversimplification, of course. Biological systems are exponentially more complex than literal locked doors. But it illustrates how a drug’s efficacy can be foiled by confounding variables in vivo. Homeostatic mechanisms may identify the medicinal interloper as a threat. Like an adversarial immune response, the body’s regulatory processes counteract the treatment, as metabolism ramps up to accelerate its degradation before its target, or compensatory feedback loops are activated to blunt the response. Evolution has honed these defenses over eons – foiling our chemical intrusions.
With simple disorders, we’ve already plucked the low-hanging fruit. Prior generations found silver bullet treatments that directly and permanently relieved symptoms. The current shift from novel synthetic drugs to biologics may extend this opportunity and allow more treatments based on single drugs. But remaining diseases result from hugely complex and intersecting biological pathways, and silver bullets gave way to pattern recognition and statistical correlation – with mixed results.
When this post was originally written, a call to “revisit compounds that have initially discarded for reasons other than toxicity” was suggested. I’m happy to say that In Silico testing has become a reality in the interim. In no way I am claiming credit (although you never really know) but it was a likely outgrowth of application of statistical learning, tapping electronic health data. Repurposed drugs like phenoxybenzamine, entacapone and dimethyl fumarate have been the result.
However, a surfeit of data runs the risk of not only curve-fitting, but also increasing degrees of freedom and the number of comparisons runs the risk of discovering statistically significant, but spurious relationships. It is crucial to ensure that chance causality is excluded – hence the need for multi-dimensional statistical corrections like Holmes-Bonferroni and Bowmanini. Methods must be robust, and interpretations grounded in sound scientific and statistical reasoning.
Still, opportunity exists in mining troves of patient data to uncover statistical relationships and patterns between treatments, diseases, and outcomes. While randomized trials struggle to accommodate multiplying variables, big data analytics and longitudinal cross-validated EHR studies can add to the picture. They may reveal places where our existing tools, in new combinations, tested first in silico and only advanced to clinical trials when likely to succeed, can turn the tide on refractory illnesses inadequately treatable like vasospasm. This is in no way a solved problem – the answers we seek may already exist buried within the overwhelming noise of modern medicine’s myriad observations. But by listening to the data, we just may hear medicine’s deepest truths whispered through the cacophony.
Note: Update 4/22/20: Since this post was first written there has been a great deal of information released about the novel coronavirus COVID19, with an equal amount of confusion. Many preprints have been released to satisfy the hunger for information about this new and concerning disease. Unfortunately, there are both problems in quality and veracity and source material must be considered, as not all is of the same quality, and frankly, some might be intentional misinformation.
After this blogpost was published, Radiology leadership from the organized specialty societies came out with the recommendation NOT to use imaging on COVID-19 patients for diagnosis, but only for investigation of a worsening clinical course not explainable by COVID. Many AI projects were initiated of extremely poor/questionable quality, using as few as 5 cases for training. (!) I’ll instead suggest an adaptation of the 2018 RSNA pneumonia challenge winner which is being hosted on the Arterys platform if you are looking for such a product . (Full Disclosure: I have no financial interest in Arterys or the makers of that product)
I’ve tried hard to avoid hype for the purposes of this blog. So as to the question – is AI useful in detecting COVID via imaging? At this time I don’t know – further imaging data and study will be needed. My hope is that the point is somewhat moot, as if accurate rapid PCR tests and antibody testing are widely available, the need for detection via imaging will be less of a concern, and I think that is why the specialty societies argued against imaging as a front line diagnostic tool.
First post in a while. This was supposed to be “Wither Value? – an update on Value Based Care in 2020” But that can wait as the coronavirus situation in China gives us pause.
First off, our hearts go out to the afflicted in China, especially Wuhan. Diseases like COVID afflict randomly and pass sentence indiscriminately upon their victims, uncaring of race, creed, national origin, or political affiliation. We can all appreciate the primary risk is simply being alive and in the wrong place at the wrong time. As human beings, we all are potentially vulnerable.
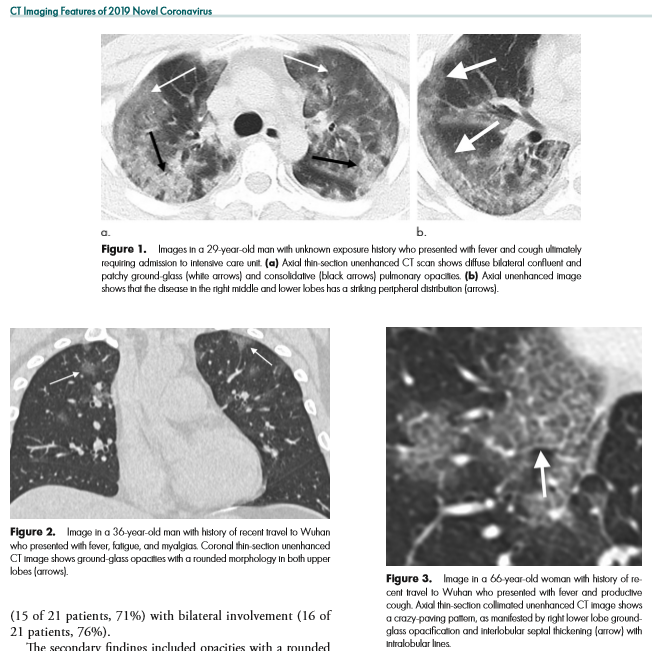
I write this after the nearly doubling of reported cases following a change in diagnostic criteria, first brought to my attention 2/12/20 by Scott Gottlieb, former FDA commissioner. Previously, the only reported cases were those confirmed by PCR, and some people commented that cases were rising steadily at about 3000/day. That might have been the capacity limit of national PCR testing. Clearly though, imaging (specifically a CT scan showing bilateral patchy ground glass opacities which are fairly typical of viral pneumonitis but nonspecific) is becoming part of the diagnostic algorithm, and revealing a more extensive distribution which was suspected from anecdotal social media reports.
Which begs the question – could AI help?
Radiology – CT Imaging Features of 2019 Novel Coronavirus
As CT imaging now is part of the diagnostic criteria, we have an opportunity to take positive CT scans from patients with positive COVID-19 PCR and make an initial, standardized dataset which could be in DICOM format. It should be as high quality as possible, and ideally have the ground glass opacities and progressive consolidation / ARDS-like appearance labeled with bounding boxes. If that Chinese startup with $100 million in funding doesn’t have the appropriate tools, my friend George over at MD.AI does. Once the basic dataset is created, a second dataset with similar, presumptive cases based upon the new WHO criteria (CT scan +, Wuhan contact, lymphopenia) can be assembled with weak labeling, perhaps aided by some semi-supervised learning techniques to make the labeling less onerous (similar to what we did in this paper). In order not to make it an ARDS detector, initially presenting imaging should be used. A similar number of controlled negative cases should be assembled for the dataset with a negative label. Then a classifier can be trained for detection / absence of disease.
While such a CT-based classifier would prove helpful in the developed world and urban China, the developing world is not helped by this CT classifier. For that reason, it would be prudent to create a dataset of standard chest radiographs from the ground truth positive patients identified in the two CT datasets above. This would hold value, with or without the bounding boxes and could be used for screening purposes.
Chest X-ray based deep learning screening would be useful for the rest of the world where not only access to advanced imaging is limited, but also access to radiologists. Studies can wait for up to 60 days to be interpreted by a physician in some developing countries. Chest X-ray is also less bulky and more portable, and could also be used at borders and immigration control points in conjunction with temperature checks to assess for potential geographic spread of COVID-19.
Part of the Value of AI in this circumstance is the rapid reproduction and dissemination of knowledge in front of a clear and present danger. Physicians might simply not know of COVID-19’s findings or not recognize them because they are too unlikely in their practice. Therefore, those first few cases slip by, and allow for increased local infections. The ability to be proactive is valuable. The dataset, and to a lesser extent any actual model represents a rapid transfer of knowledge among physicians. Dissemination of the dataset, and eventual AI classifier is limited only by internet access and end-user integration. The cost of developing such a single-purpose classifier would be miniscule – on the order of a research grant. More is being lost by economic slowdown on an hourly basis.
With the dataset open sourced, new cases could be added either on a collective basis via a registry created by governmental or NGO’s for this purpose or administered by a respective country’s health department/ministry. Additional cases could be added, and supervised by local academic physicians, who would be best suited to detect spectrum shift in disease presentation if the virus should mutate and change its pathologic presentation.
So, this post is predominantly aimed at my Asian colleagues who are simply by virtue of their location, present at the epicenter of this illness. To the healthcare professionals of the middle kingdom – it must be difficult to be witness to what you are seeing – I cannot even personally conceive it. You have a long tradition of excellence in the healing arts, stretching back to Hua Tuo of the Three Kingdoms and beyond. Receive my heartfelt respect for taking up the rod of Aesculapius at personal risk to yourself in order to minister to the needs of others. In conjunction with your close research colleagues, you are in a unique position to create this database – you have the clinical case knowledge and the PCR data. Furloughed or idle technologists, residents, and radiology physicians can annotate the data you provide, not only providing +disease / -disease labels on CT slice images, but bounding boxes on the areas of pulmonary involvement. While you are doing that, take the presenting chest x-ray and do the same! Those steps, by the way, can be done from home, over the internet. Once assembled into a high quality labelled dataset of a sufficient number of cases, release it publicly for the good of all people and nations. Models can be created and shared on the internet once the data is released. At the last RSNA I saw a neat open-source data lake for imaging data /DICOM called KHEOPS – perhaps this would be a way to accomplish this across users and platforms.
Coronavirus image from sciencemag.org – used under fair use principles for scientific purposes.
I’m aware that this post might not age well. On the other hand, I have a bit of a bully pulpit so I am going to use it. It is far too easy to fall either into hysteria or indifference when faced with a fearsome circumstance. I believe that rationality combined with empathy is the best response.
The original captain of the starship Enterprise, James T. Kirk addressed his ship with the invocation of, “Computer, …” . For an audience in the late 1960’s it was a imagined miracle hundreds of years in the future. In the early 1990’s, MIT’s SAIL Laboratory was dreaming of Project Oxygen – an ever-present, voice activated computer that could be spoken to and give appropriate responses.
“Hi, Siri” circa 2011
“Hello Alexa” circa 2016
Cloud computing, plentiful memory, on-demand massive storage and GPU-powered deep learning brought this future into our present. Most of us already have the appliance (a smartphone) capable of connecting us to scalable cloud computing resources. Comparing current reality to the 1960’s expectations, this advancing world of ubiquitous computing is small, cheap, and readily available.
But imaging is not. The current paradigm holds imaging as a rare, special, and expensive medical procedure. In the days of silver-film radiology, with tomographic imaging and cut-film feeders for interventional procedures, it was a scarce resource. In the first days of CT and MRI, requests for anything more complicated than an x-ray needed to pass through a radiologist. These machines, and the skills necessary to operate them, were expensive and in short supply.
But is it still? In a 2017 ER visit – the point of access to health care for > 50% of patients – if your symptoms are severe enough, it is almost a certainty you will receive imaging early in your ER visit. Belly pain? – CT that. Worst headache of your life? – CT again. Numbness on one side of your body? Diffusion Weighted MRI. And it is ordered on a protocol circumventing Radiology approval – why waste time in the era of 24/7 imaging with final interpretations available in under an hour.
This is an aggressive statement. We’re not ready for it just yet. But let me explain why Ubiquitous Imaging is not so far off.
Imaging is no longer a limited good in the developed world
Artificial intelligence will increase imaging productivity, similar to PACS
Concerns about radiation dose will be salved by improvements in technology
Radiomics will greatly increase the value of imaging
Contrast use may be markedly decreased by an algorithm
Imaging will change from a cost center to an accepted part of preventative care in a value-based world.
Physicians may shift from the current subspecialty paradigm to a Diagnosis-Acute Treatment-Chronic Care Management paradigm to better align with value based care.
Each of these points may sound like science fiction. But the groundwork for each of these is being laid now:
If proper procedures are followed with appropriate staffing and a lean/six sigma approach to scanning, it is conceivable that a modern multislice CT could scan one patient every ten minutes (possibly better), and be run almost 24/7 (downtime for maintenance & QA). Thus, one CT scanner could image 144 patients daily. 144 scans/day x 365 days/year x 13120 CT scanners = 689,587,200 potential scans yearly – two scans a year for every US resident!
MRI imaging is more problematic because physics dictates the length of scans. The T1 and T2 relaxation times are set by the length of the sequence in milliseconds, and making scans faster runs up against the laws of physics. While there are some ‘shortcuts’, we pay for those with T2* effects and decreased resolution. Stronger magnets & gradients help, but at higher cost and a risk of energy transfer to the patient. So at optimal efficiency and staffing, the best you could probably get is 22 studies daily (a very aggressive number). 22 MRI studies/day x 365 days/year x 12480 MRI’s = 100,214,400 studies yearly. Or enough to scan 1/3 of the US population yearly. (Recent discussions at RSNA 2017 suggest MRI scans might be able to be shortened to the length of CT)
Think about this. We can CT scan every US citizen twice in a one year period, and we continue to think about imaging as a scarce resource. One in three US citizens can be scanned with MRI annually. Imaging is not scarce in the developed world.
X-ray is the most commonly performed imaging procedure, including mammography & fluoroscopy, accounting for up to 50% of radiology studies. The CT/MR/US and nuclear medicine studies occupy the other 50%. A bit of backing out on the number above will suggest capacity on the order of 2.256 billion possible studies a year.
We’ve done the studies – how will we interpret them? A physician (MD) examines every study and interprets them, delivering a report. There are about 30,656 radiologists in the USA (2012 AMA physician masterfile). Nieman HPI suggests that estimate may be low, and gives an upper range of 37,399 radiologists.
A busy radiologist on a PACS system could interpret 30,000 studies a year. 30,656 x 30,000 = 919,680,000 potentially interpretable studies from our workforce. Use the high estimate and the capacity number rises to 1.12 billion. That’s a large variance from the 2.256 billion studies performed. However, it is suggested that about 50% of studies, usually X-ray and Ultrasound, are performed and interpreted by non-radiologists. So, that gets us back to 1.12 billion studies.
Artificial Intelligence algorithms are beginning to appear in Radiology at a rapid pace. While it is early in the development of these products, there is no question in the minds of most informed Radiologists that computer algorithms will be a part of radiology. And because AI solutions in radiology will not be reimbursed additionally, cost justification needs to come from productivity. An AI algorithm in Radiology needs to justify its price by making the radiologist more efficient, so that cost is borne by economies of scale.
Now imagine that the AI algorithms develop accuracy similar to a radiologist. Able to ‘trust’ the algorithms and thereby streamline their daily work processes, Radiologists no longer are limited to interpreting 30,000 studies a year. Perhaps that number rises to 45,000. Or 60,000. I can’t in good conscience consider a higher number. The speed of AI introduction, if rapid and widespread, may cause some capacity issues, but the aging population, retiring radiologists, well-informed medical students responding to the “invisible hand” and perpetual trends toward increasing demand for imaging services will form a new equilibirum. Ryan Avent of the Economist (who’s book Wealth of Humans is wonderful reading) has a more resigned opinion, however.
However, an interesting pilot study used an AI technique on CT scans to ‘de-noise’ the images, improving their appearance. The noise was added after artificially after the scan, rather than present at the time of imaging. A number of papers at NIPS 2017 dealt with super-resolution. Could similar technologies exist for imaging? Paras Lahkani seems to think so.
Put hardware & software improvement together and we might be able to substantially decrease dose in ionizing radiation. If this dose is low enough, and research bears out that there is a dose threshold below which radiation doesn’t cause any real effects, we could “image gently” with impunity.
Are we using the information in diagnostic imaging effectively? Probably not. There is just too much information on a scan for a single radiologist to report entirely. But with AI algorithms also looking at diagnostic images, there is much more information that we can extract from the scan than we currently are. The obvious use case is volumetrics.
The burgeoning science of Radiomics includes not only volumetrics, but also relationships between the data present on the scan we may not be able to perceive directly as humans. Dr. Luke Oakden-Rayner caused a brief internet stir with his preliminary precision radiology article in 2017, using an AI classifier (a CNN) to predict patient survival from CT images. While small, it showed the possibility of advanced informational discovery on existing datasets and application of those findings in a practical manner. Radiomics feature selection has similar problems to that of genomics feature selection, in that the large number of data variables may predispose to more chance correlations than in traditionally designed, more focused experiments.
At the RSNA 2017, a number of machine learning companies were making their debut. One of the more interesting offerings was Subtle Medical, a machine learning application designed to reduce contrast dose in imaged patients. Not only would this be disruptive to the contrast industry by reducing the amount of administered contrast by a factor of 5 or higher (!), but it would remove one of the traditional concerns about contrast – its potential toxicity. CT uses iodinated contrast, and MRI uses Gadolinium-based contrast. Using less implies less toxicity and less cost, so this is a win all-around.
The economics of imaging could fill a book, let alone a blog post. In a fee-for service world, imaging was a profit center, and increasing capacity and maximizing the number of imaging services was sensible to encourage a profitable service line. With declining reimbursement, it has become less so (but still profitable). However, as we transition to value-based care, how will radiology be seen? Will it be seen as a cost-center, with radiologists fighting over a piece of the bundled payment pie, or something else? Will it drive reduced or increased imaging utilization? Target metrics and ease of attainment in the ACO drive this decision, with easier targets correlated with greater imaging. Particularly if imaging is seen as providing greater value, utilization should continue to rise.
Specialty training as it exists currently may not be sufficient to prepare for the way medicine is practiced in the future. A specialty (and sup-specialty) approach was reasonable when information was not freely available, and the amount of information to know was overwhelming without specialization. But as we increase efficiencies in medical care, care access goes along a definable path: Patient complaint -> Investigation -> Diagnosis -> Acute Treatment ->Chronic Treatment. Perhaps it would make more sense to organize medicine along those lines as well? Particularly in the field of diagnosis, I am not the only physician recognizing the shift occurring. A well-thought out opinion piece written by Saurabh Jha MD and Eric Topol MD, Radiologists and Pathologists as Information Specialists, broaches that there is more similarity between the two specialties than differences, particularly in an age of artificial intelligence. Should we call for a new Flexner report, ending the era of physician-basic scientists and beginning the dominance of physician-informaticists and physician-empaths?
Perhaps it is time to consider imaging not as a limited commodity, but instead to recognize it as a widely available resource, to be used as much as is reasonable. By embracing AI, radiomics, new payment models, the radiologist as an informatician, and basic research on radiation safety, we can get there.
There is a developing data science, machine learning, and deep learning community in the South Florida area that I support. The topics were diverse, from business intelligence to online ad buying to health tech. I was invited by Data Science Salon to attend and I was really pleased to do so.
The conference was hosted by Formulated.by and was held in Miami’s CIC near University of Miami/Jackson Memorial Hospital. It was a two day conference – I attended only the second day.
I got through the traffic in Miami just in time to make the tail end of the Meditation exercise. I’ll be honest – talking about data science gets me excited, so I really wasn’t in the mood to calm down. Miami traffic also doesn’t make me calm down. But it was fun, nonetheless.
Brian MacDonald of the Florida Panthers started off with an interesting presentation about how the Florida Panthers, as an organization, solved the problem of how much to charge for their seats in a game, which ended up being a very traditional data science problem, beginning with an exploration of the data, discerning relationships in that data, and then creating predictive models. It turns out that the demand of seats is related to: day of week, opposing team, home team performance, holidays (some were highly negative, like Valentine’s day) and how late in the season the game is being played. They utilized a regression model controlling for independent variables, and thereafter were able to predictively model sales, attendance, and even season ticket holder renewals.
Michael Conway from Bidtellect spoke on their self-service predictive analytics platform for online ad bidding – which is using the Vertica service. Eye opening (for me as a physician) that they are participating in 15,000,000,000 (yes, number is accurate) auctions daily for online ad placement. Communicated that engagement rates are important, and by measuring post-click consumer activity you can document the value of the ad.
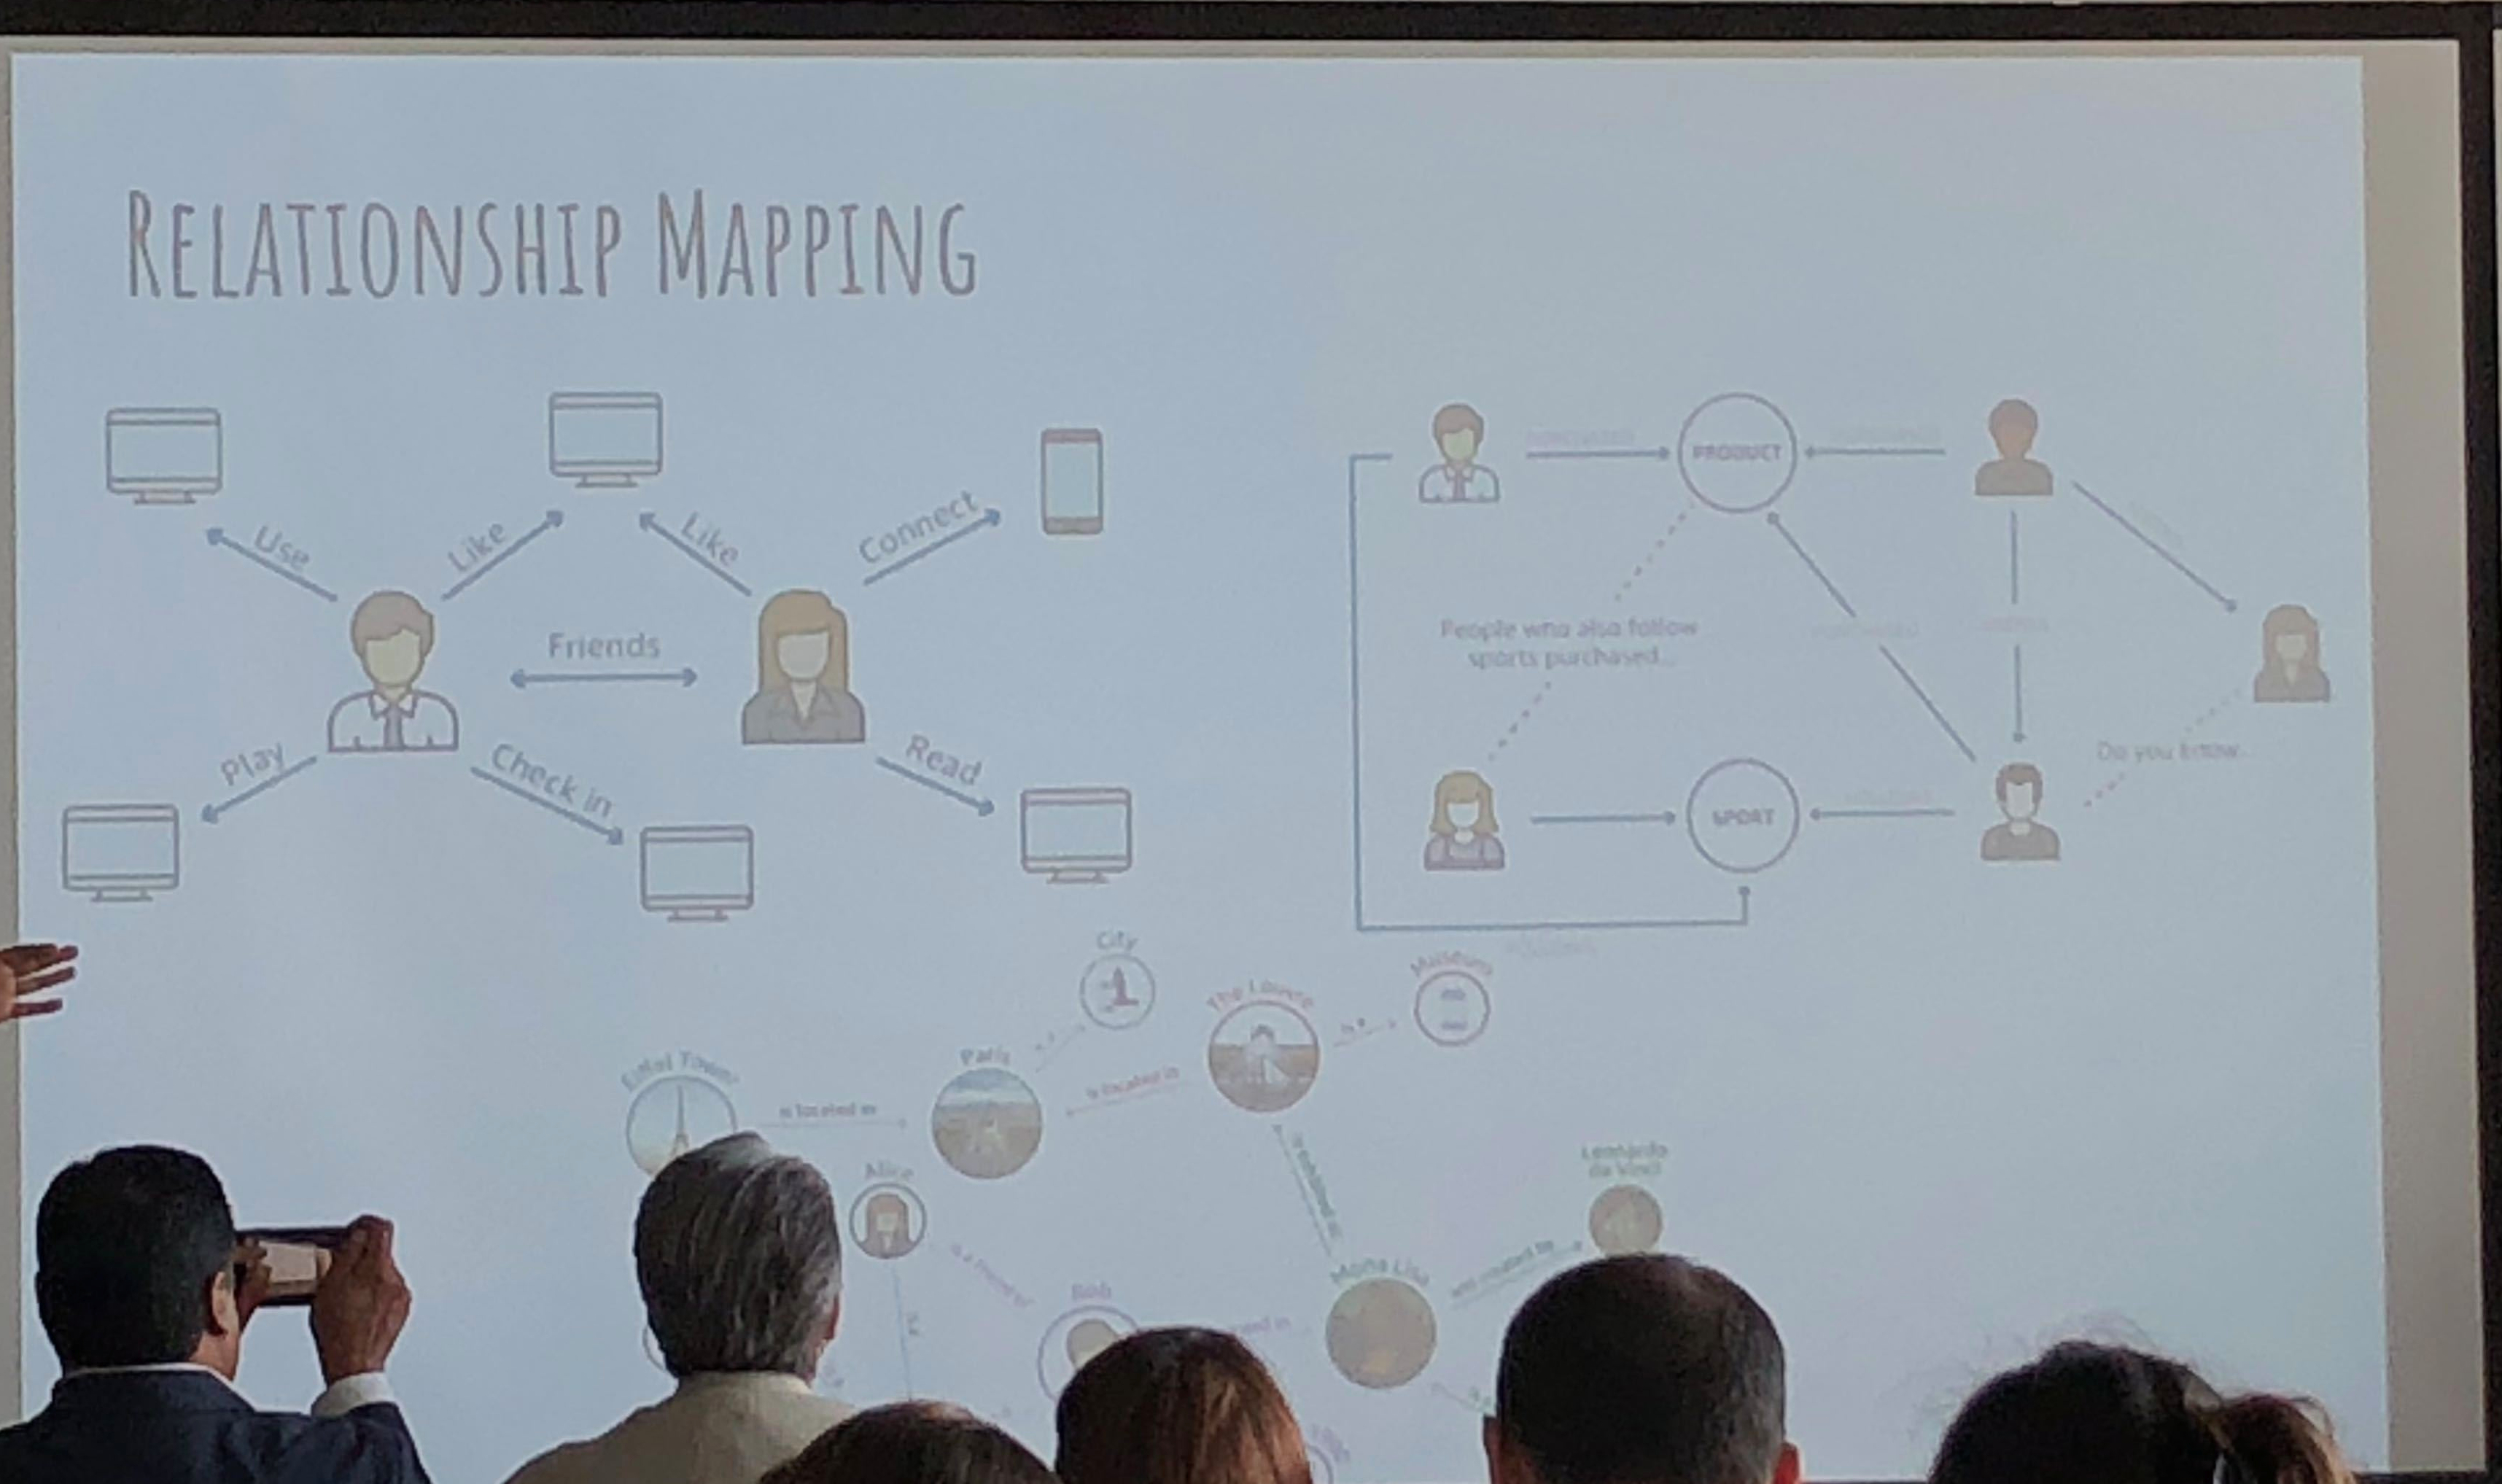
Relationship Mapping by Carnival Data Science Team used in social selling
The data science team of Kevin U and Mark Fridson from Carnival Cruise Lines spoke – this was a really excellent talk, first about digital transformation of a traditional Fortune 500 company, and then some nuts & bolts. Kevin hammered home the importance of having a data-driven culture, which flows from the highest levels of the organization to spur adoption and deal with “change management” (That exists in healthcare too, by the way). One reality of being in South Florida was the skills gap – qualified data people are hard to come by.
Mark discussed the importance of multichannel engagement via snail mail, email, and social media as digital channels – sharing insights closely tied to generational cohorts. For each age group, Carnival has an “ideal customer” which they try to match as closely as possible to Boomers respond best via snail mail (USPS), while Gen X and Millenials use email and social media. For Generation Z, its all social media, but for different purposes. Snapchat creates exposure, while Instagram represents captured moments. Facebook is for acquaintance update and communication, and Twitter is most useful for interest and influencers. I thought that breakdown was particularly useful for those in marketing.
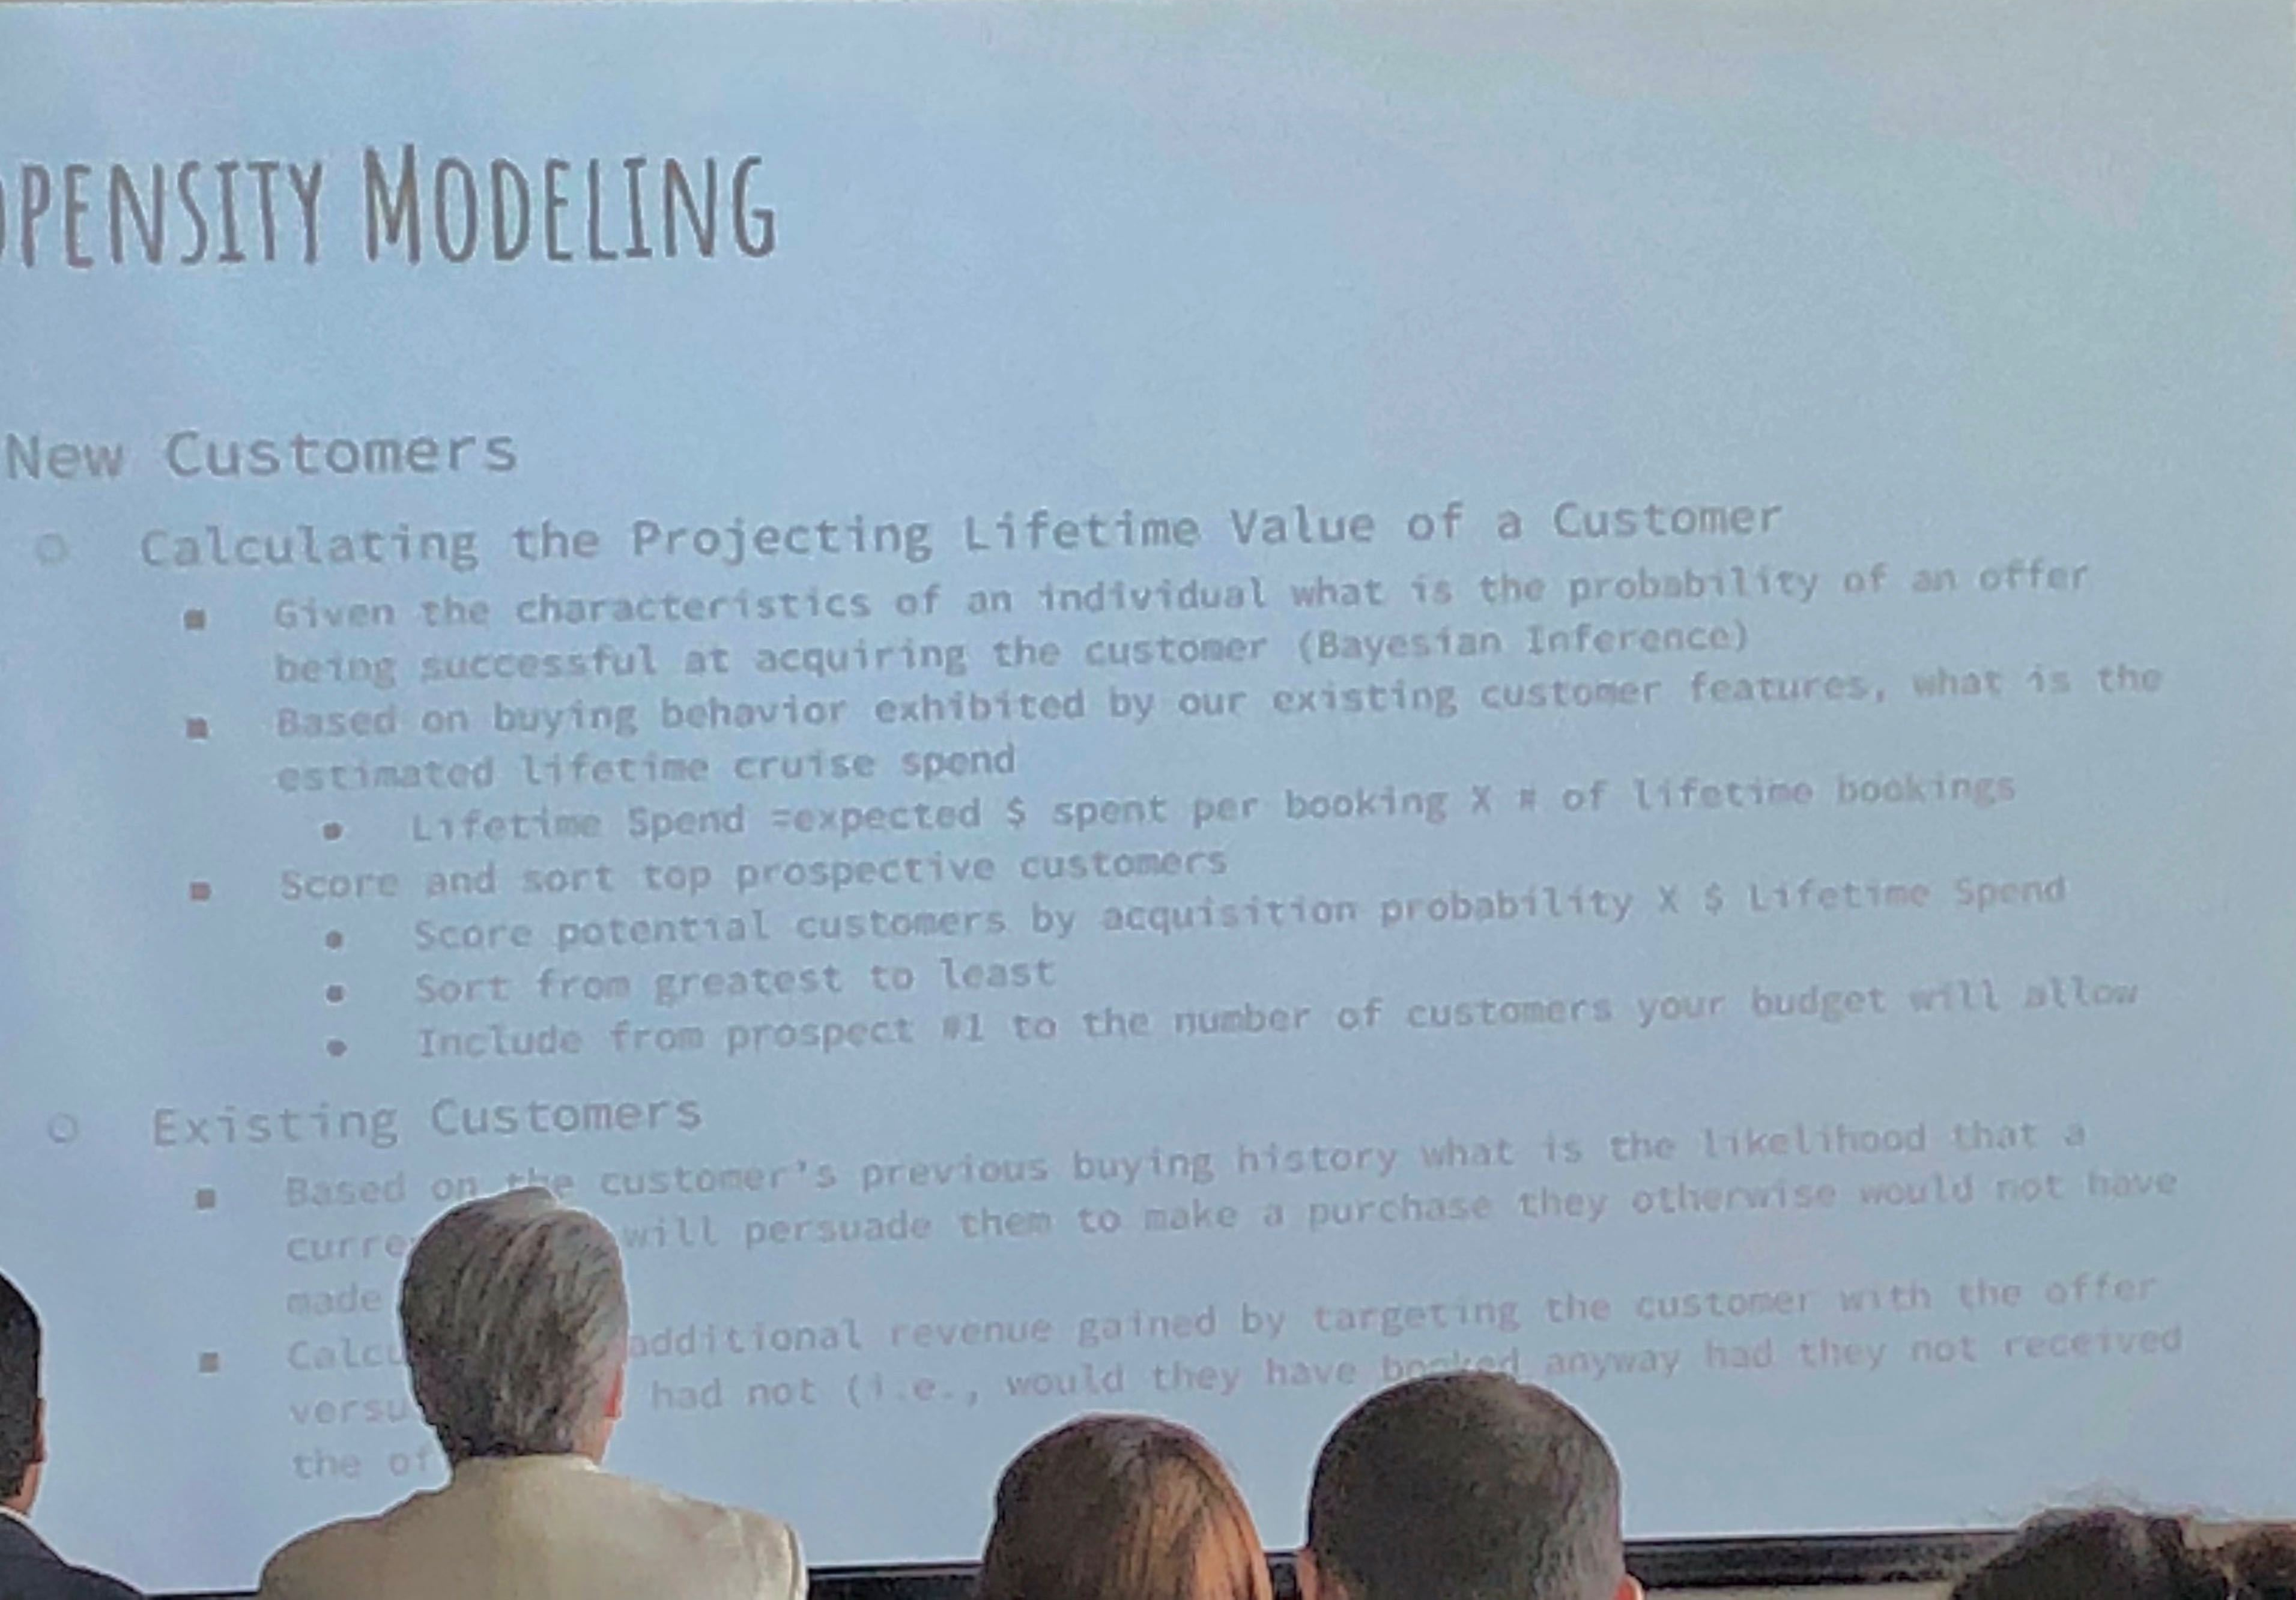
Propensity Modeling by Carnival Data Science Team for Customer Lifetime Value
They use propensity modeling to calculate CLV (Customer Lifetime Value) and use Bayesian analysis. Content personalization is performed with: demographics, frequency, booking patterns, after-purchase add-ons, and even an element of serendipty (! – remember that piece on antifragility I did? These guys get it). They do use social relationship mapping and have been using some NLP text analysis but feel its hard to use AI NLP in SoMe.
Catalina Arango next spoke, and her talk was non-technical, aimed at beginners and managers desiring to implement data science elements in their enterprises. I took this opportunity to speak to the Dataiku and Vertica folks as this was a refresher for me.
Next up was Alex Rubynstein from Mt. Sinai in NYC – Mt . Sinai is One of the more proactive medical centers in the country regarding analytics and recognizing the value of data. I have seen them advertising for multiple positions to monetize their research.
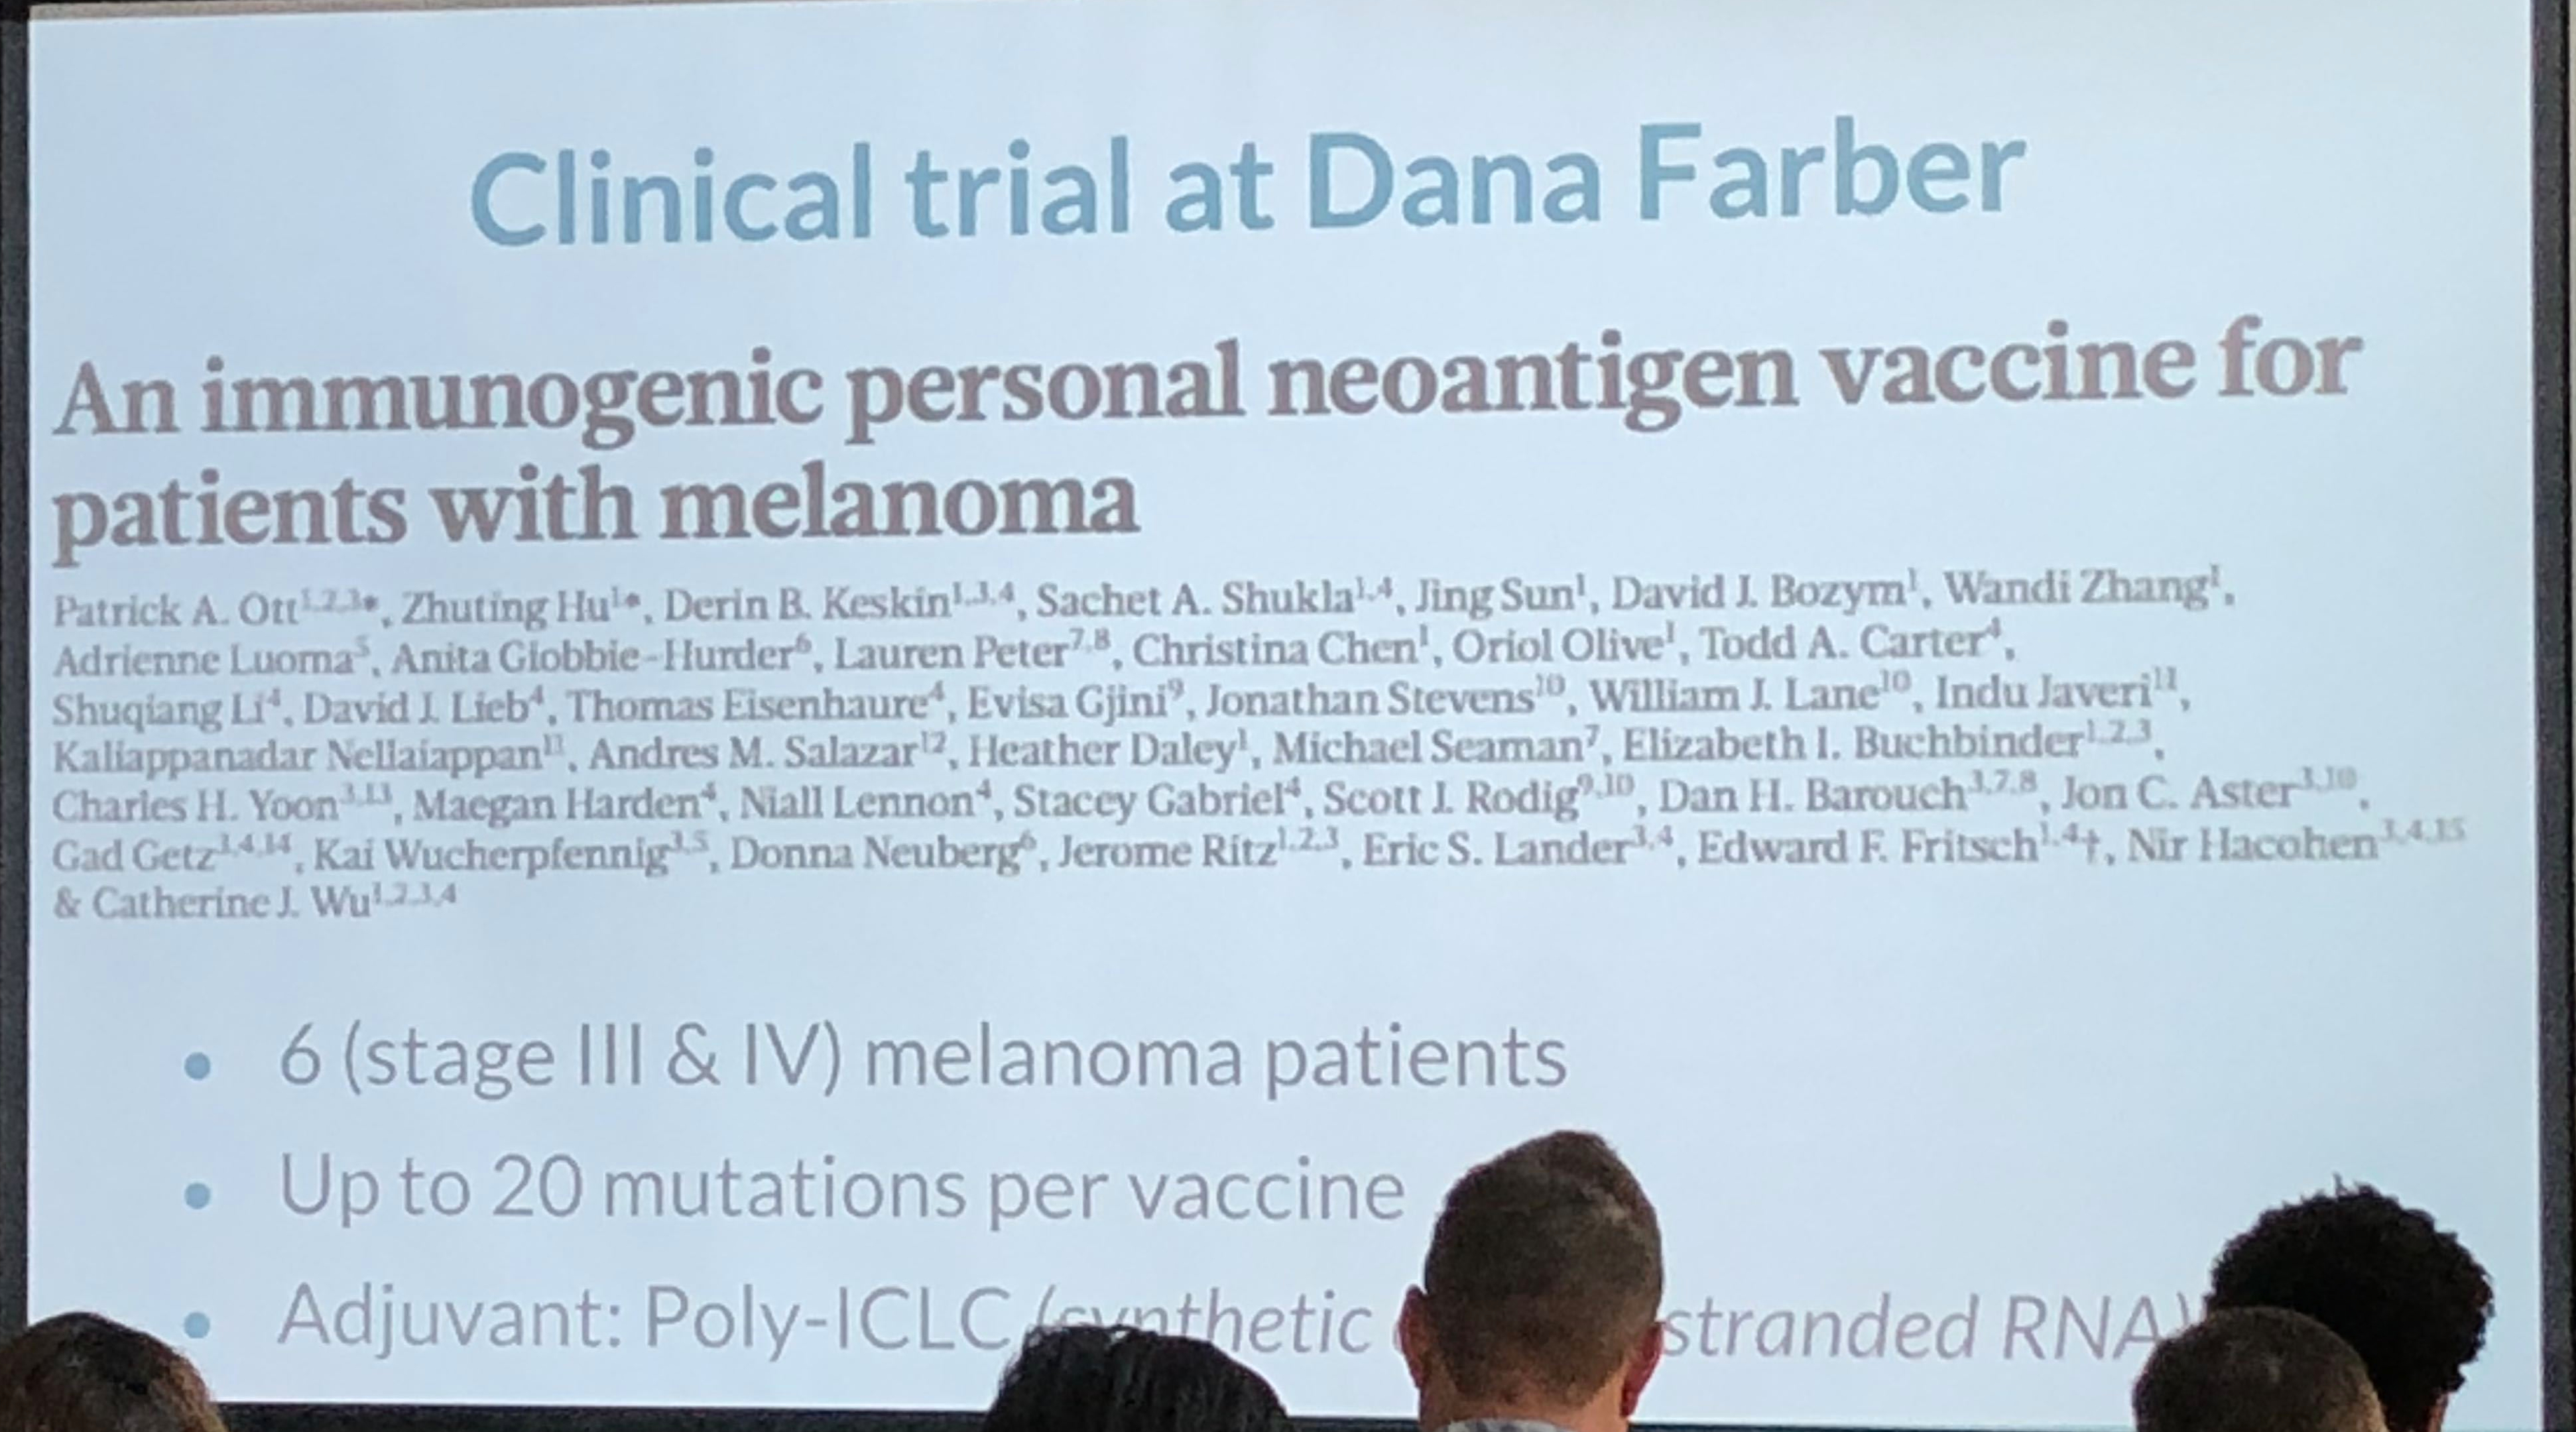
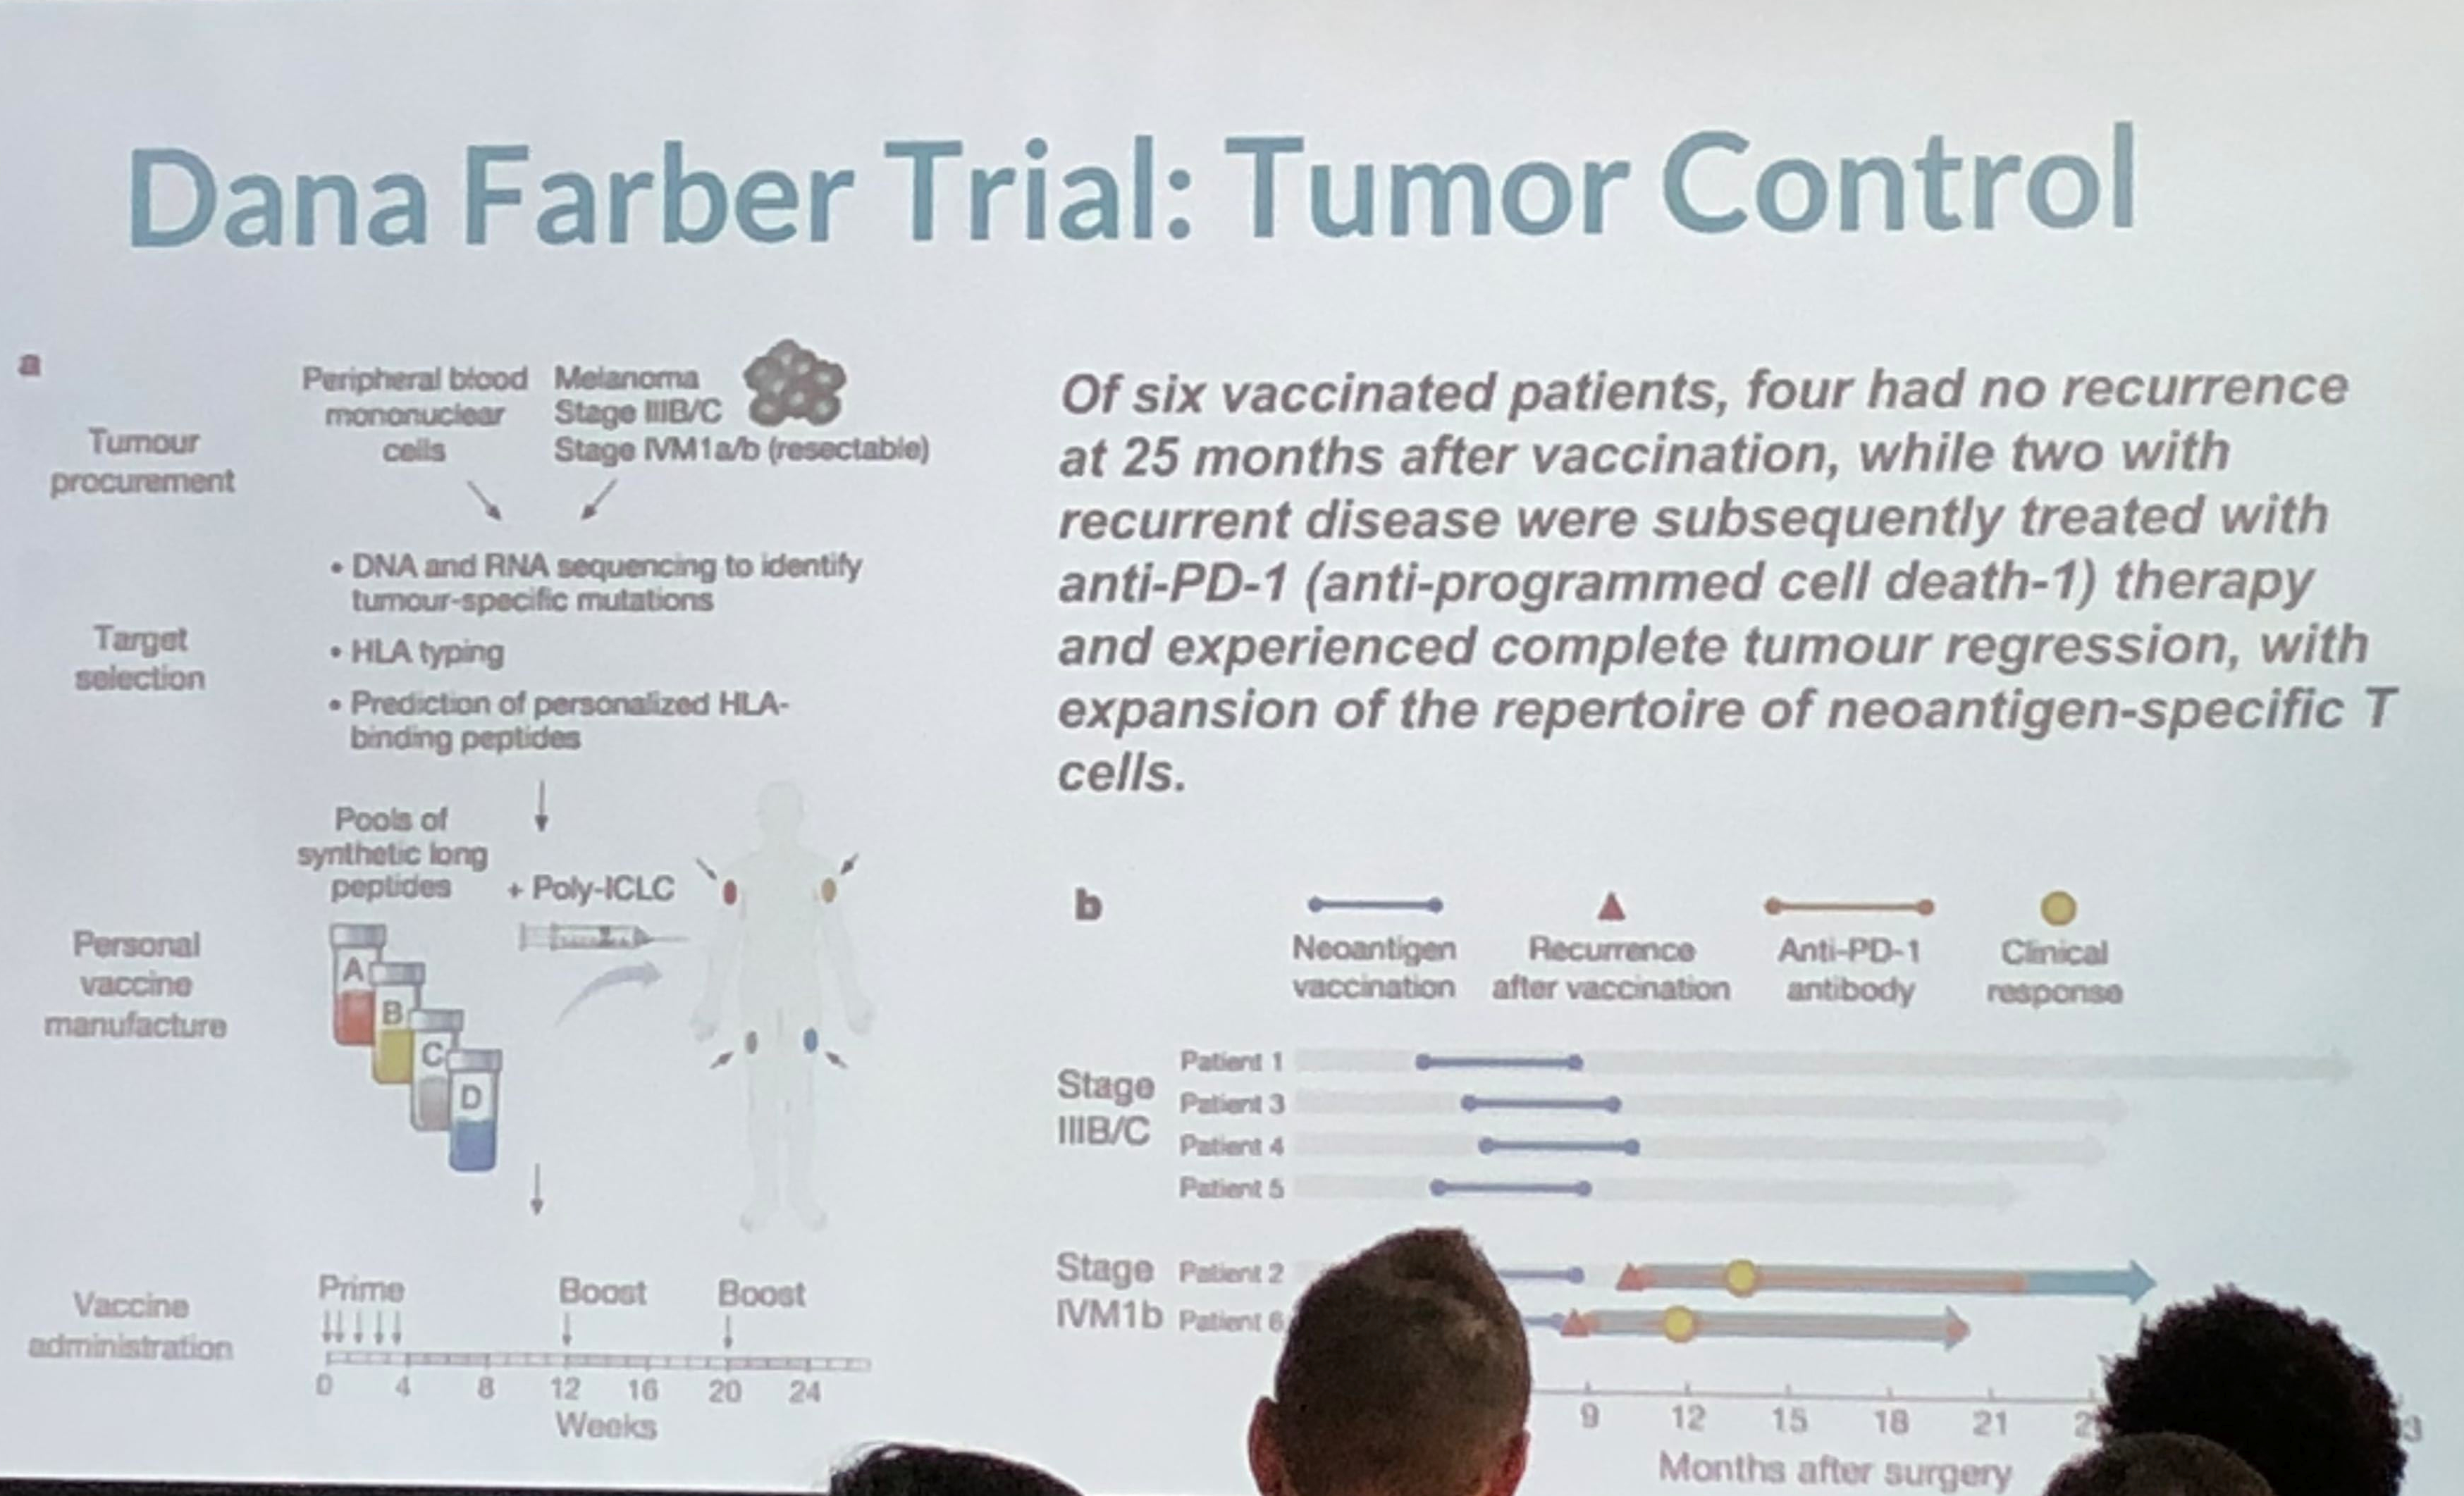
4/6 recipients of vaccine were disease free 25months after vaccine while 2/6 with recurrent disease were subsequently treated and experience complete cancer regression.
This was an interesting take on personalized medicine and genomics using big data for analysis. Because of cancer’s lethality, more experimentation is possible which have resulted in some novel therapies which approach cure, or at least transforming cancer into a chronic condition. The cancer vaccine approach treats the patient’s immune system to either enhance the immune response (to overcome immune suppression) or to increase the sensitivity of the immune system to the cancer (to overcome immune escape). They take the patient’s gene sequence, and the tumor gene sequence, filter the two and target on the order of 5-20 mutations, combining the vaccine with an adjuvant. They use machine learning on the candidate targets as the number of mutations exceeds the number of targets. They are continuing to expand on their sample size, which is extremely small, and because of the individualized nature of the therapy, very costly. Nevertheless, early results are promising. The primary limitation is the individualized and handcrafted nature of the vaccine.
Lunch followed – Subway sandwich boxes, which were fine. Networking at a data science conference can be tough (stereotypes anyone?) but I managed to find a few good folks to chat with.
A panel followed composed of three speakers – Dr. Irma Fernandez, chief academic officer of St. Thomas University; Colleen Farrelly, Data Scientist at Kaplan; Mauro Damo, chief data scientist at Dell; and Anton Antonov, Consultant at Accendo Data. There were a broad number of topics discussed. Main points were the following: Publishing data can be damaging, so be aware of what you are putting out there. Narrow AI only at this time – no general AI (we know that)! This was a good, in-the-fields survey of current trends and issues.
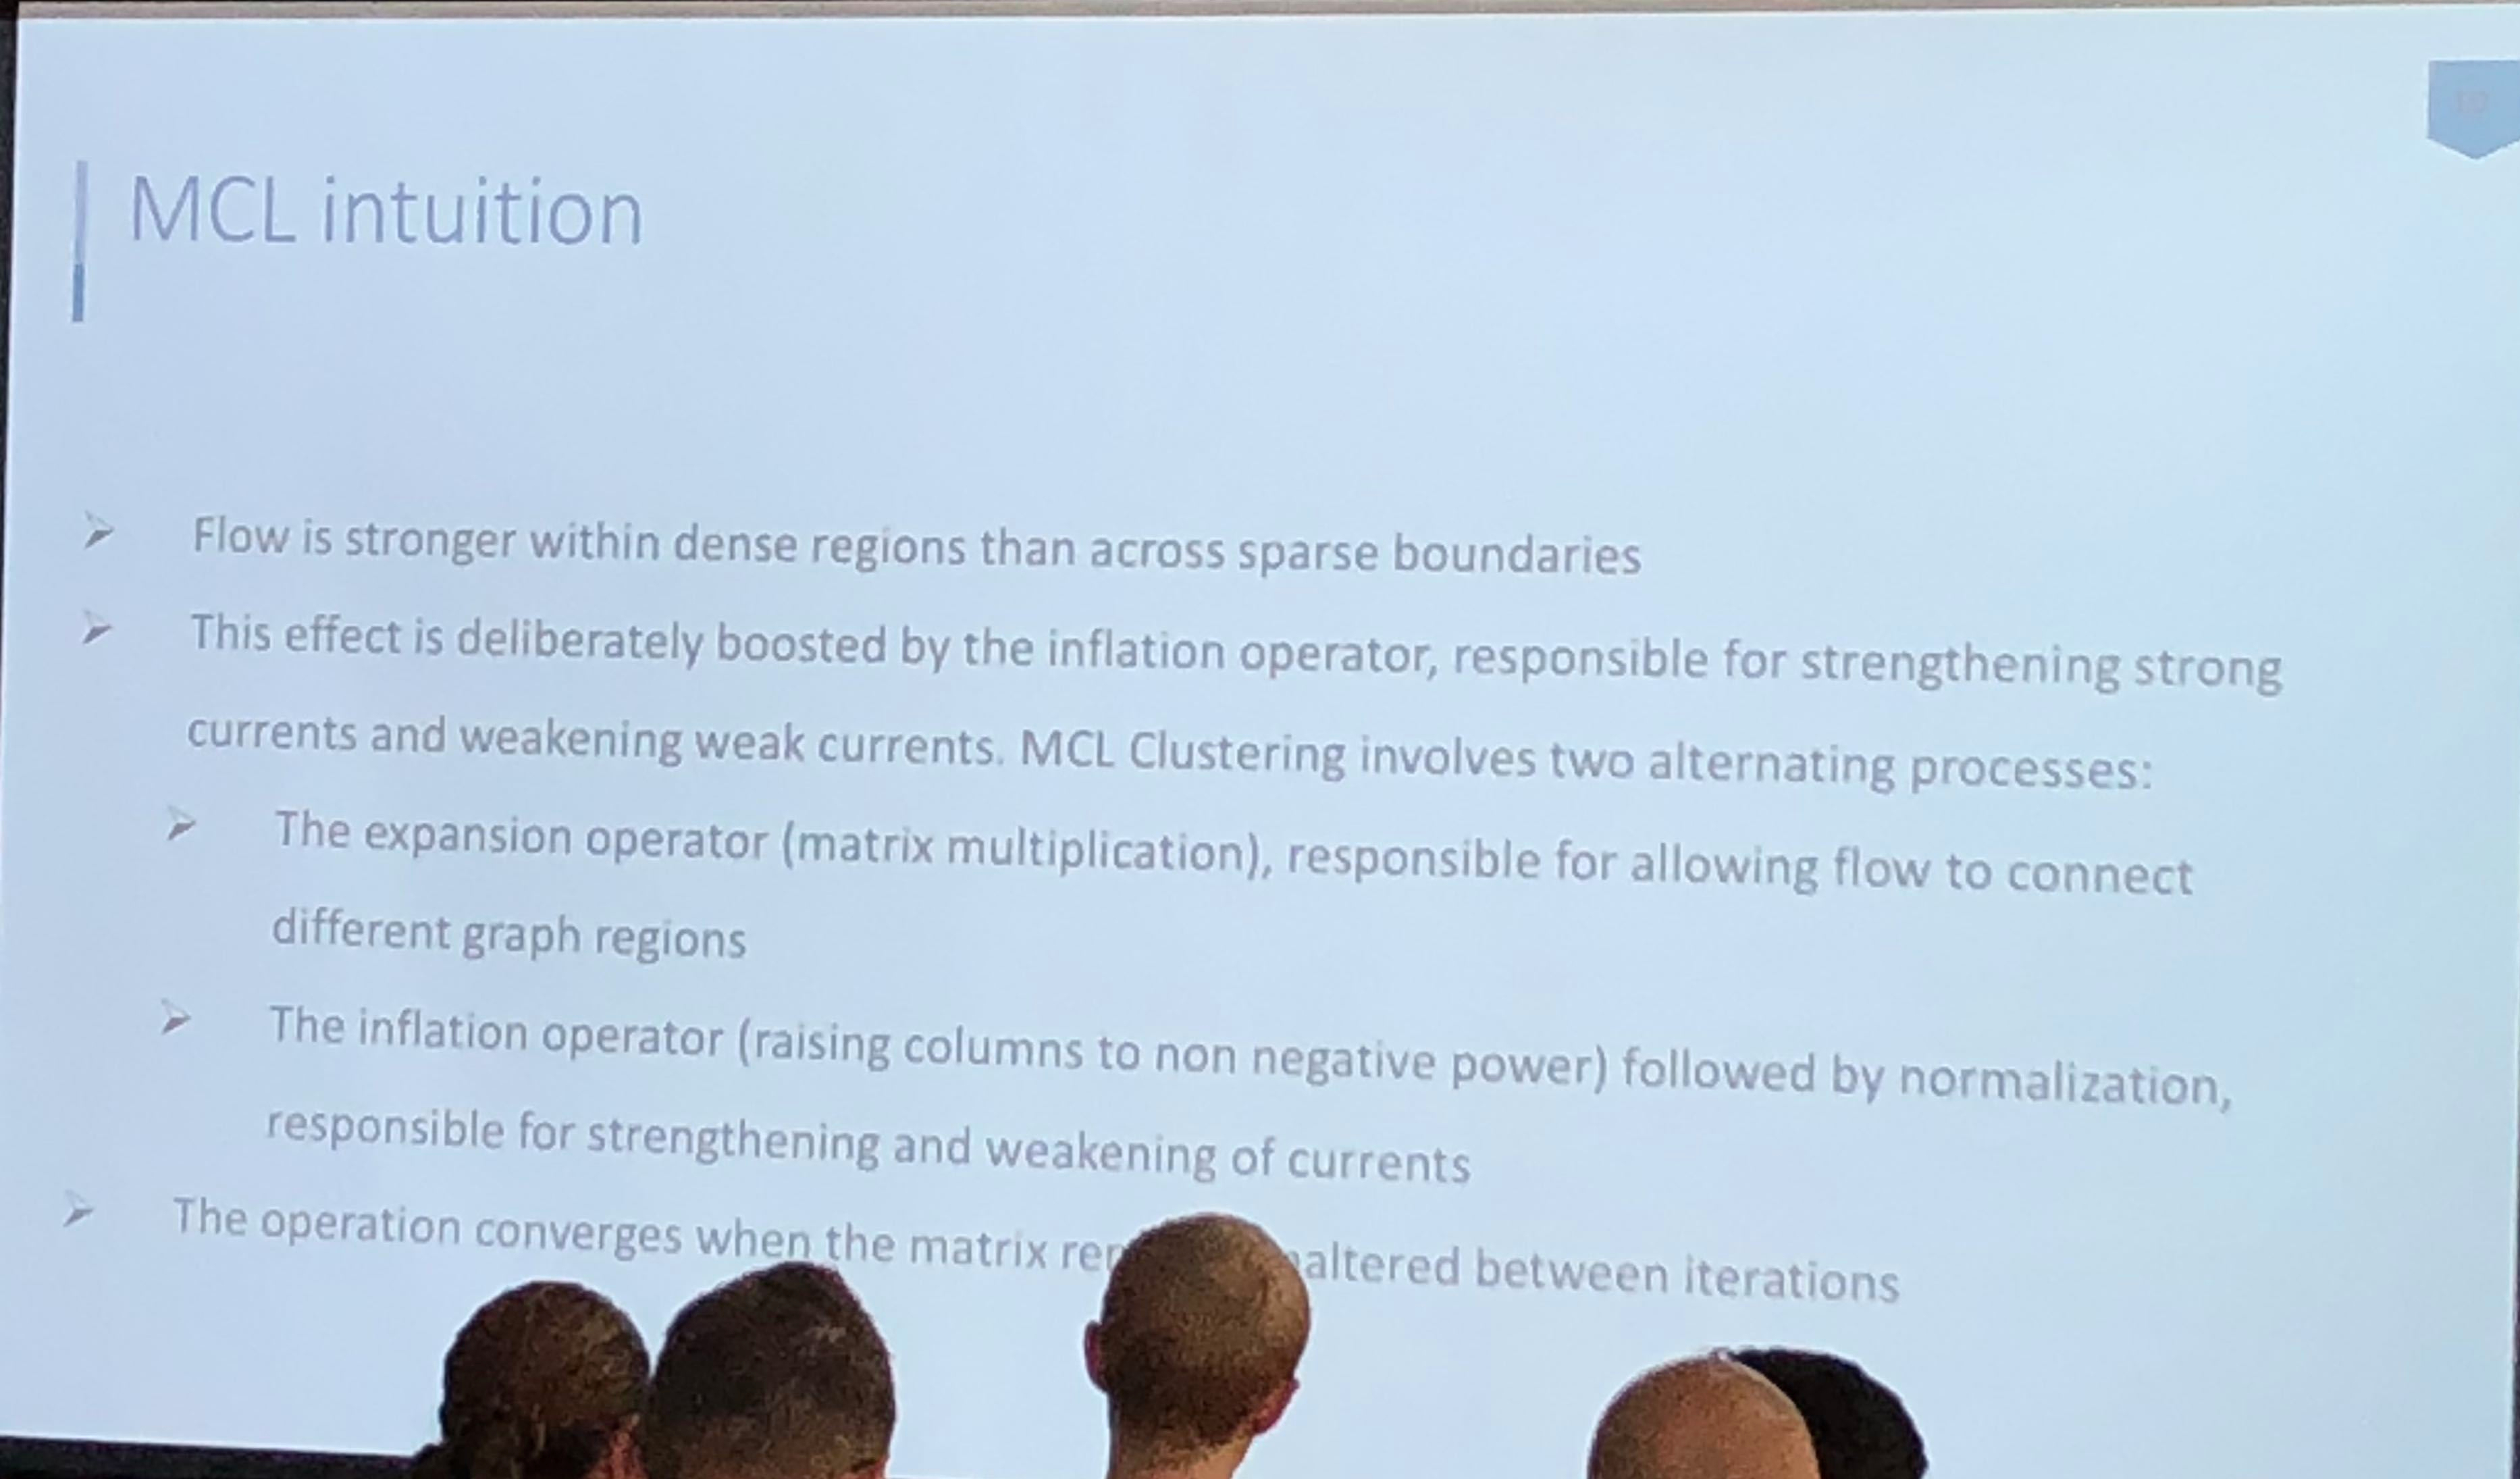
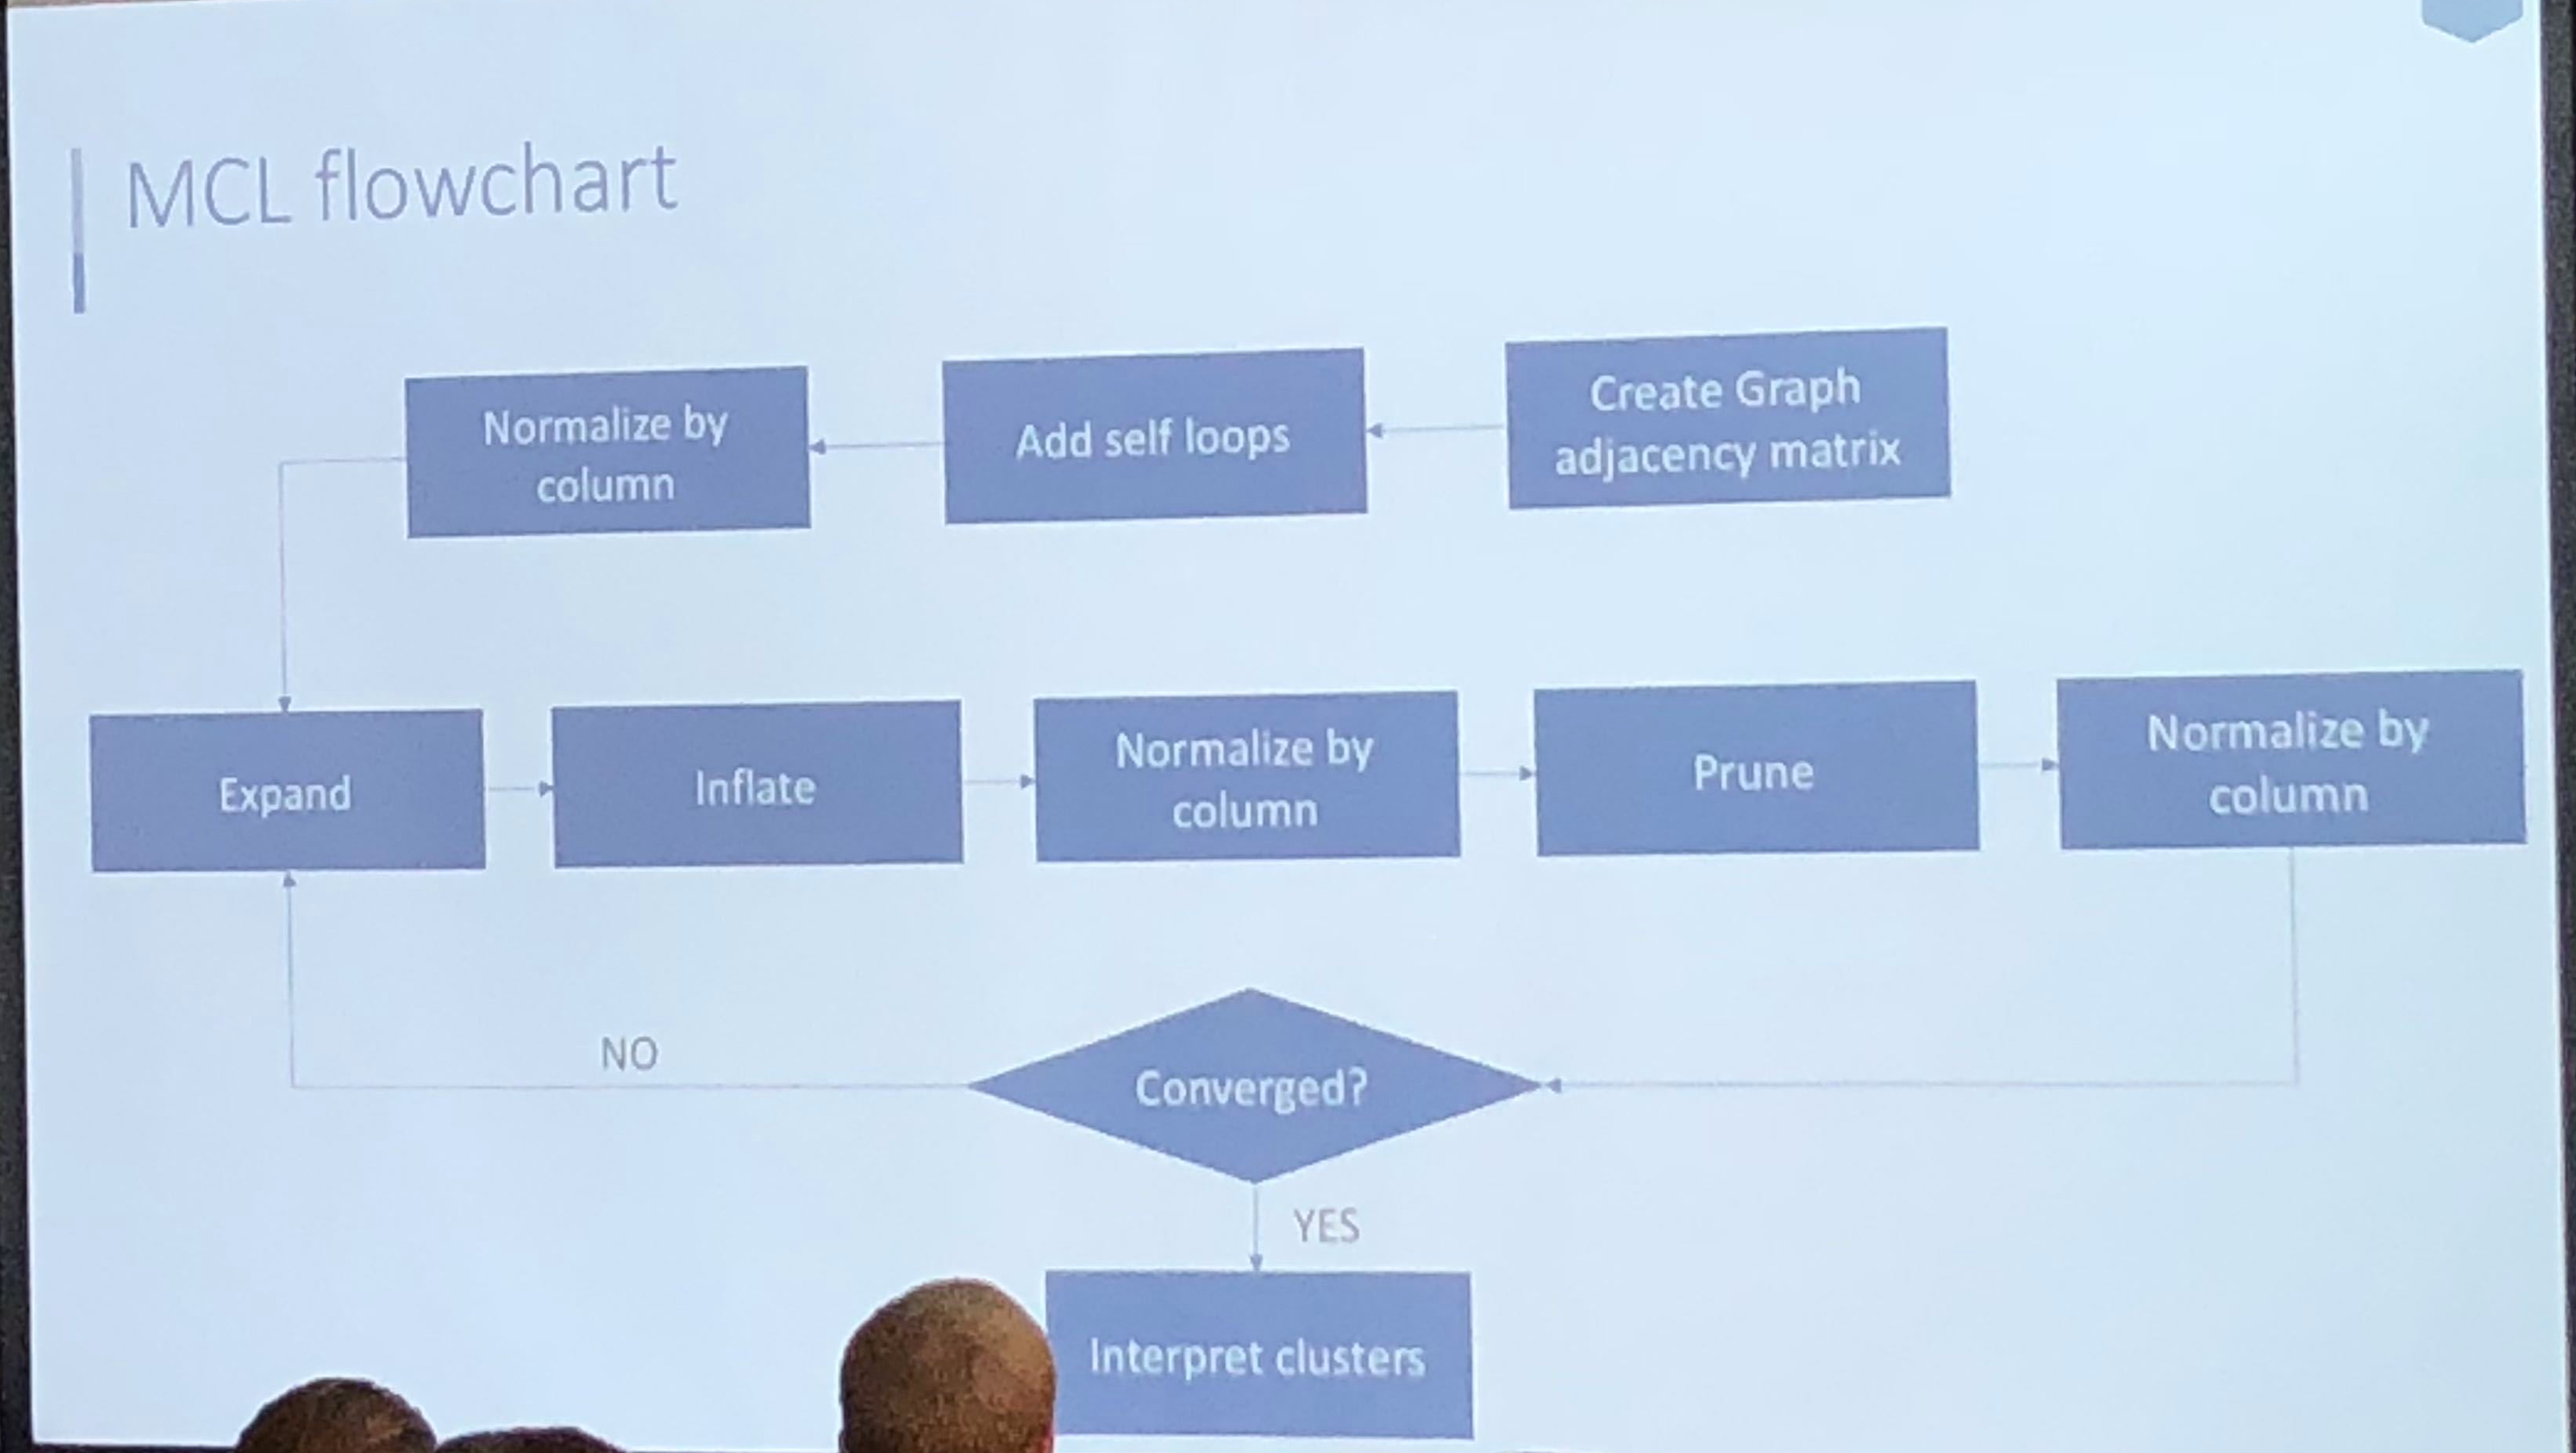
Athanassios Kintaskis, Sr. Machine Learning engineer at Capital One had an interesting presentation on MCL (Markov Clustering) Sparse Graphs – this was a good technical talk, some of which went over my head. As opposed to K-means clustering algorithms which are sensitive, but can’t tell you how many groups are present (you need to choose), this approach simulates random walks in a graph and uses a flow dynamic to create clusters.
Markov Chain transitions can be modeled as a matrix, and that’s about as far as I got before I was interrupted by a phone call. This was an interesting and meaty talk, and I probably need to read up more on the topic before publically displaying my ignorance.
Anabetsy Rivero of Metastatic AI gave a nice introductory presentation on Convolutional Networks in medical imaging (head over to my other blog: www.ai-imaging.org for more on that or read my prior articles on this). Anabetsy is a machine learner that is focusing on breast cancer diagnostics.
There were a few other presentations but this is a blog, not a manifesto!
All in all, I appreciated what Formulated.by did to bring this type of conference to Miami. It is a necessary part of growing the Miami Data Science community, and I would love to see more events like Data Science Salon in the future. A 2nd DataScienceSalon:Miami is slated for November 6-7, 2018.
FULL DISCLOSURE: Because of my involvement in the South Florida Data Science and Machine Learning community, I received complimentary entrance.
Author’s Note: This was a fun side-project for the American College of Radiology’s Residents and Fellows Section. Judy Gichoya and I co-wrote the article. The original article was posted by Judy to Medium and appeared on HackerNoon. It was really an enlightening gathering of experts in the field. There is a small, but hopefully growing number of radiologists who are also deep learning practitioners.
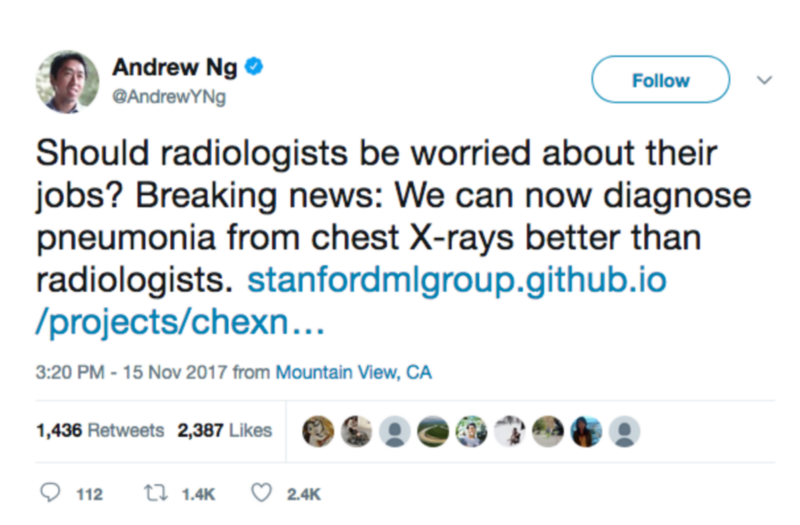
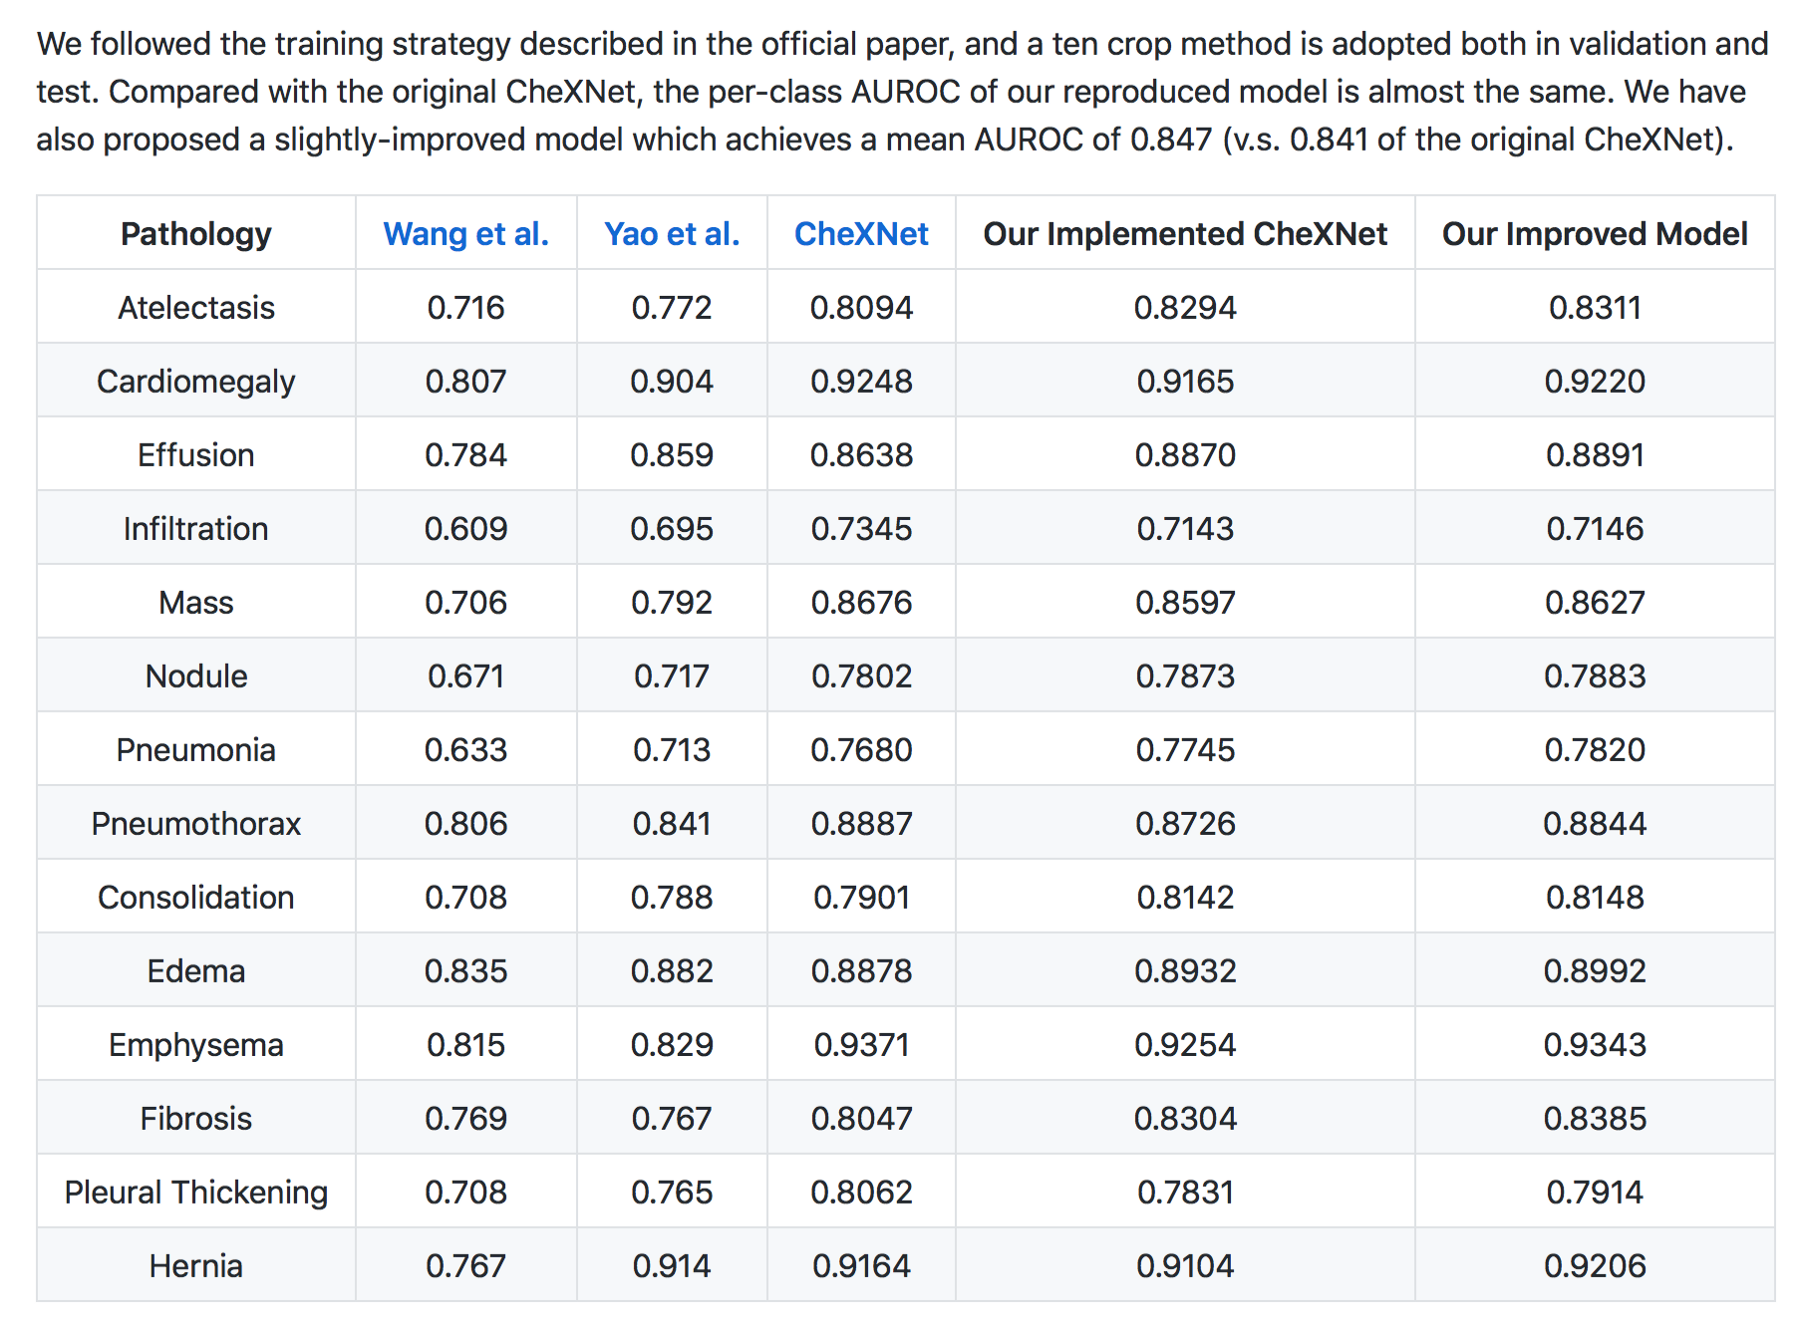
In December 2017 , we (radiologists both in training, staff radiologists and AI practitioners) discussed our role as knowledge experts in world of AI, summarized here https://becominghuman.ai/radiologists-as-knowledge-experts-in-a-world-of-artificial-intelligence-summary-of-radiology-ec63a7002329. For the month of January, we addressed the performance of deep learning algorithms for disease diagnosis , specifically focusing on the paper by the stanford group — CheXNet: Radiologist-Level Pneumonia Detection on Chest X-Rays with Deep Learning. We continue to generate a large interest in the journal club , with 347 people registered , 150 of whom signed on January 24th 2018 to participate in the discussion.
The paper has had 3 revisions and is available here https://arxiv.org/abs/1711.05225 . Like many deep learning papers that claim super human performance , the paper was widely circulated in the news media, several blog posts , on reddit and twitter.
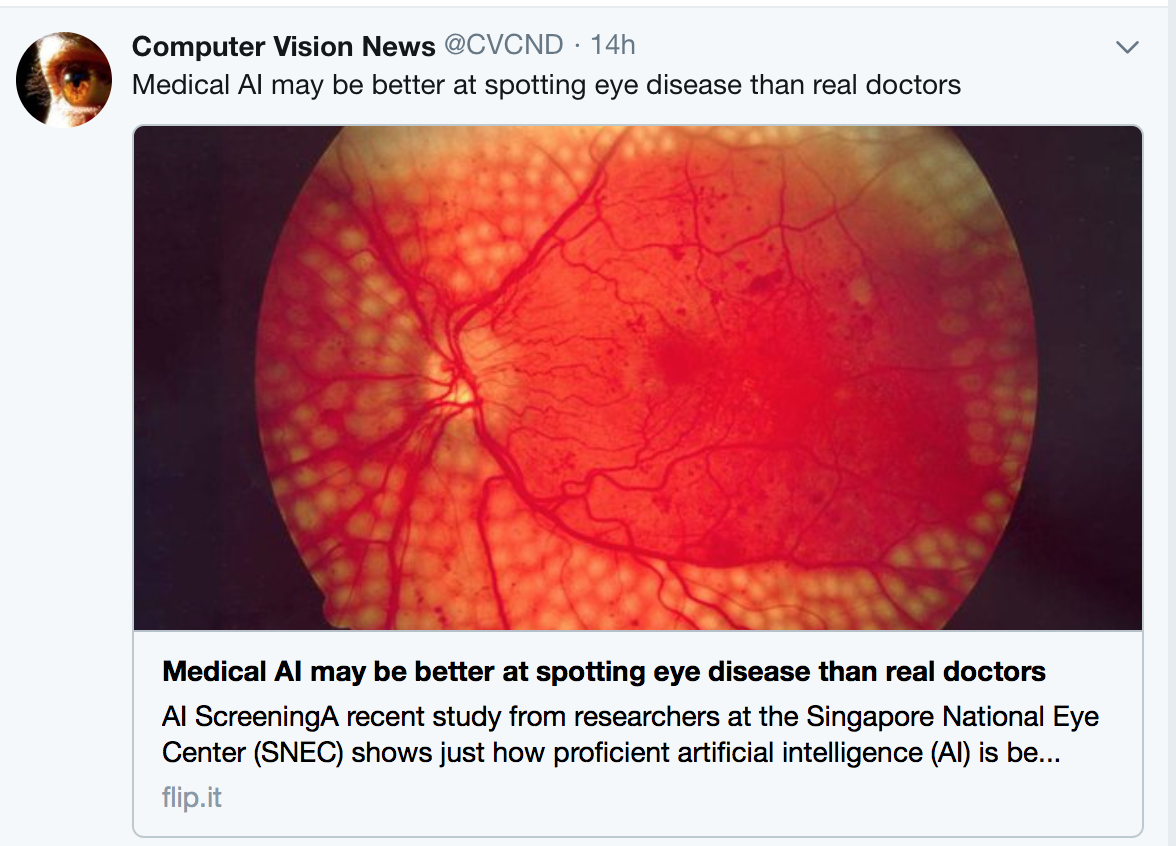
Please note that the findings of superhuman performance are increasingly being reported in medical AI papers. For example, this article denotes that “Medical AI May Be Better at Spotting Eye Disease Than Real Doctors”
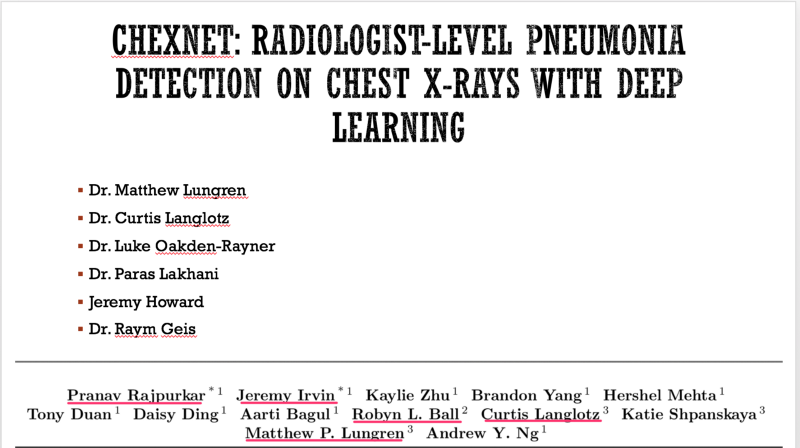
To help critique the ChexNet paper , we constituted a panel composed of the author team (most of the authors listed on the paper were kind enough to be in attendance — thank you!), Dr. Luke(blog) and Dr. Paras (blog) who had critiqued the data used and Jeremy Howard (past president and chief scientist of Kaggle, a data analytics competition site, Ex-CEO of Enlitic, a healthcare imaging company, and the Current CEO of Fast.ai, a deep learning educational site) to provide insight to deep learning methodology.
In this blog we summarise the methodology of reviewing medical AI papers.
Radiology 101
The ChexNet paper reviews performance of AI versus 4 trained radiologists in diagnosing pneumonia. Pneumonia is a clinical diagnosis — a patient will present with fever and cough , and can get a chest Xray(CXR) to identify complications of pneumonia. Patients will usually get blood cultures to supplement diagnosis. Pneumonia on a CXR is not easily distinguishable from other findings that fill the alevolar spaces — specifically pus , blood , fluid or collapsed lung called atelectasis. The radiologists interpreting these studies can therefore use terms like infiltrates , consolidation and atelectasis interchangeably.
Show me the data
The data used for this study is the ChestX-ray14 dataset which is the largest publicly available imaging data set that consists of 112,120 frontal chext xray radiographs of 30,805 unique patients and expands the ChestX-Ray 8, described by Wang, et. al. Each radiograph is labeled with one or more of 14 different pathology labels, or a ‘no finding’ label.
Labeling of the radiographs was performed using Natural Language Processing (NLP) by mining the text in the radiology reports. Individual case labels were not assigned by humans.
Critique: Labeling medical data remains a big challenge especially because the radiology report is a tool for communicating to ordering doctors and not a description of the images. For example , in an ICU film with a central line, tracheostomy tube and chest tube may be reported as “stable lines and tubes” without detailed description of the every individual finding on the CXR. This can be missclassified by NLP as a study without findings. This image-report disconcordance occurs at a high rate on this dataset.
Moreover reportable findings could be ignored by the NLP technique and/or labeling schema, either through error or pathology outside of one of the 14 labels. The paper’s claims of 90%+ NLP mining accuracy do not appear to be accurate. (SMB,LOR,JH). One of the panelists — Luke reviewed several hundred examples and found the NLP labeling about 50% accurate overall compared to the image, with the pneumonia labeling worse — 30–40%.
Jeremy Howard notes that the use of an old NLP tool contributes to the inaccuracy due to the preponderance of ‘No Findings’ cases in the dataset skewing the data — he doesn’t think that the precision of normal findings in this dataset is likely improved over random. Looking at the pneumonia label, it is only 60% accurate. A lot of the discrepancy can be drawn back to the core NLP method, which he characterized as “massively out of date and known to be inaccurate”. He feels a re-characterization of the labels with a more up-to-date NLP system is appropriate.
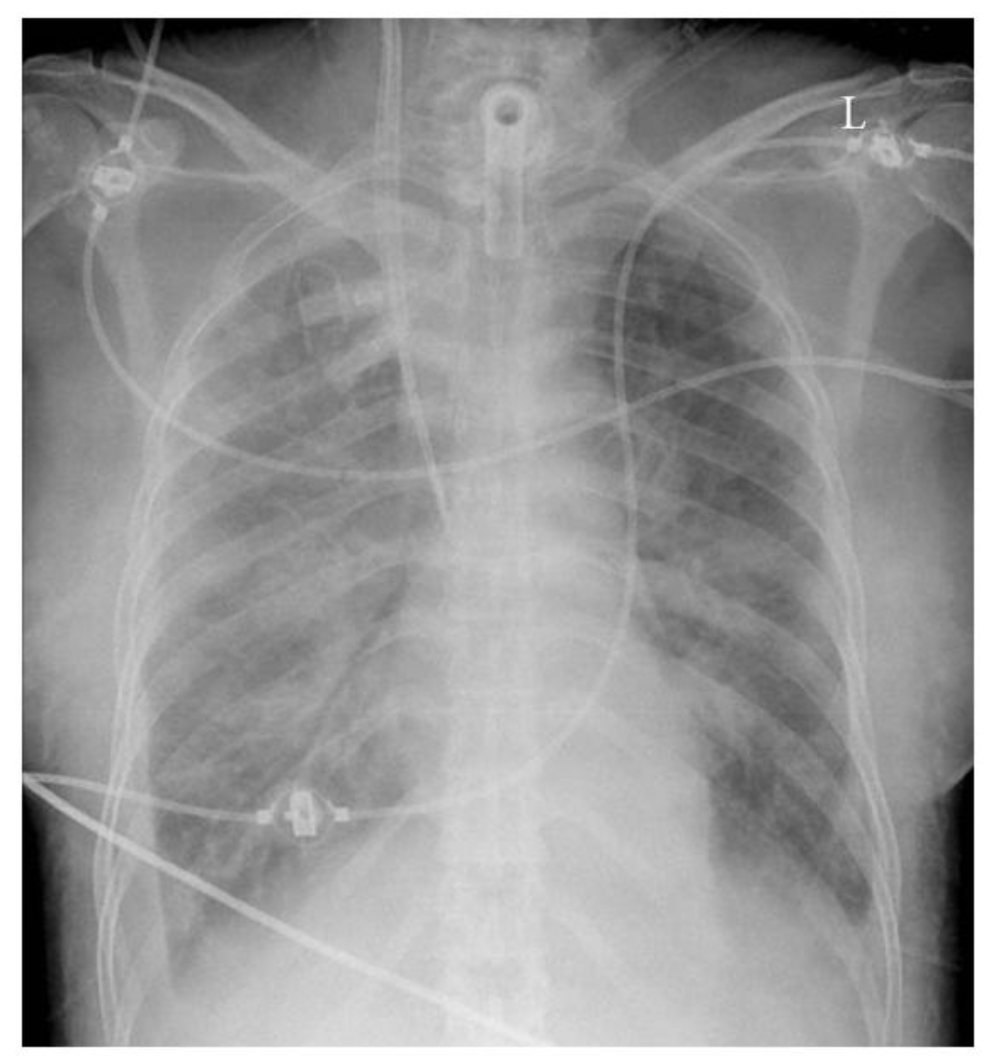
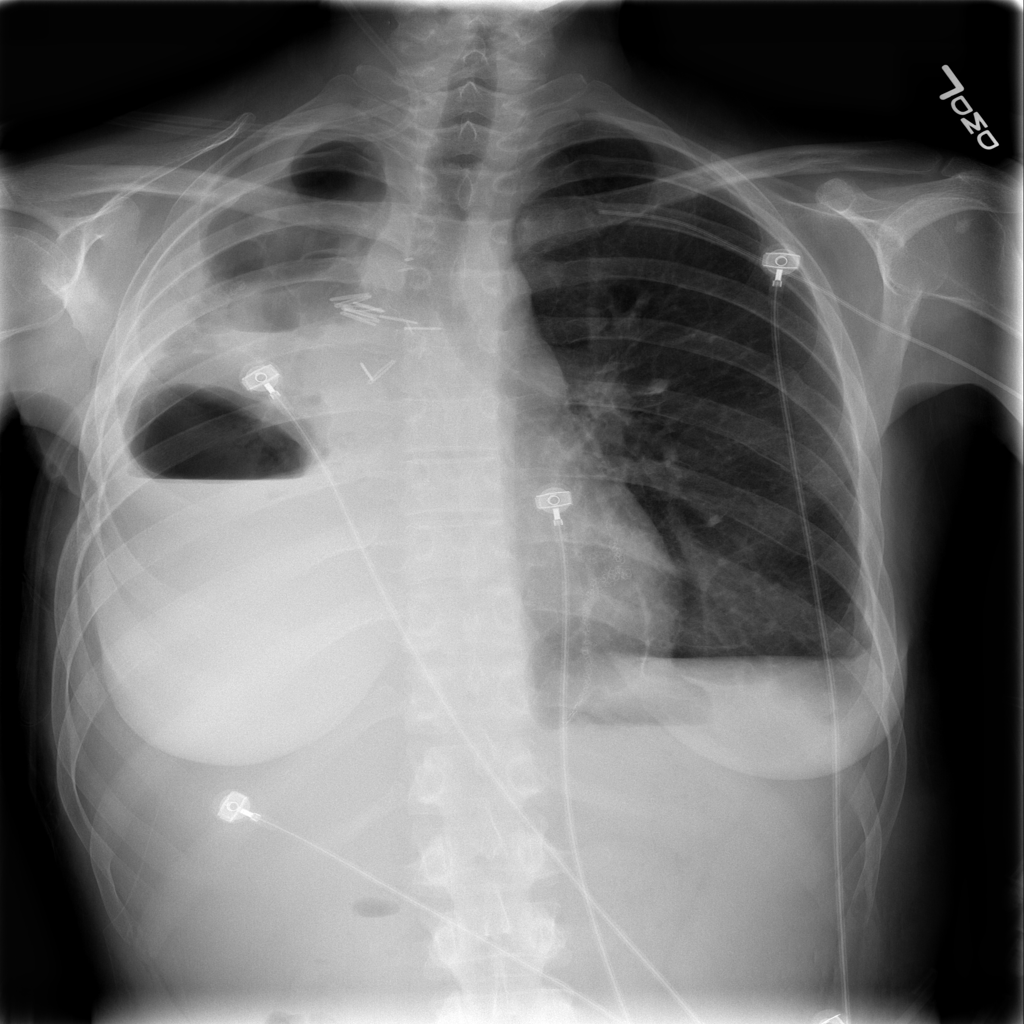
Chest Xray showing a tracheostomy tube , right internal jugular dialysis line and diffuse infiltrates likely pulmonary edema. The lines and tubes for an ICU patient are easily reported as “Stable”
The stanford group tackled the labeling challenge by having 4 radiologists (one specializing in thoracic imaging and 3 non thoracic radiologists) assign labels to a subset of the data for training created through a stratified random sampling, for a minimum of 50 positive cases of each label, with a final N=420.
Critique: The ChestXRay14 contains many patients with only one radiograph but those who had multiple studies tended to have many. While the text-mined reports may match clinical information, any mismatch between the assigned label and radiographic appearance hurts the predictive power of the dataset.
Moreover , what do the labels actually mean? Dr. Oakden-Rayner questions what the labels mean — do they mean a radiologic pneumonia or a clinical pneumonia? In an immunocompromised patient, radiography of a pneumonia might be negative, largely because the patient cannot mount an immune response to the pathogen. This does not mean that the clinical diagnosis of pneumonia is inaccurate. The imaging appearance and clinical appearance/diagnosis therefore would not match.
The closeness of four of the labels: Pneumonia, Consolidation, Infiltration, and Atelectasis introduces a new level of complexity. Pneumonia is a subset of consolidation and infiltration is a superset of consolidation. While the dataset labels these as 4 separate entities, to the radiologic practitioner they may not be separate at all. It is important to have experts look at images when doing an image classification task.
See a great summary of the data problems on this blog posting from Luke who was one of the panelists here.
Model
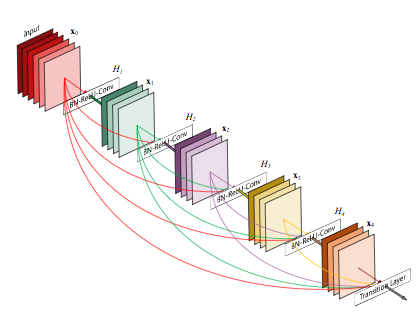
The CheXNet algorithm is a 121-layer deep 2D Convolutional Neural Network; a Densenet after Huang & Liu. The Densenet’s multiple residual connections reduce parameters and training time, allowing a deeper, more powerful model. The model accepts a vectorized two-dimensional image of size 224 pixels by 224 pixels.
Densenet
To improve trust in CheXNet’s output, a Class Activation Mapping (GRAD-CAM) heatmap was utilized after Zhou et al. This allows the human user to “see” what areas of the radiograph provide the strongest activation of the Densenet for the highest probability label.
Critique: Jeremy notes that image preprocessing of resizing to 224×224 pixel size images and adding random horizontal flips is fairly standard, but leaves room for potential improvement, as effective data augmentation is one of the best ways to improve a model. Image downsizing to 224×224 is a known issue — both from research and practical experience at Enlitic, larger images perform better in medical imaging (SMB: Multiple top 5 winners of the 2017 RSNA Bone age challenge had image sizes near 512×512). Mr. Howard feels there is no reason to leave Imagenet trained models this size any longer. Regarding the model choice, the Densenet model is adequate, but NasNets in the last 12 months have shown significant improvement (50%) over older models.
Pre-trained Imagenet weights were used, which is fine & a standard approach; but Jeremy felt it would be nice if we had a medical imagenet for some semi-supervised training of an AutoML encoder or a siamese network to cross validate patients — leaving room for improvement. Consider that Imagenet consists of color images of dogs, cats, planes and trains — and we are getting great results on X-rays? While better than nothing, ANY pretrained network trained on medical images in any modality would probably perform superiorly.
The Stanford team’s best idea was to train on multiple labels at the same time — it is best to build a single model that predicts multiple classes — counterintuitive, but bears out in deep learning models, and likely responsible for their model yielding better results than prior studies. The more classes you train the model on properly, the better results you can expect.
Results
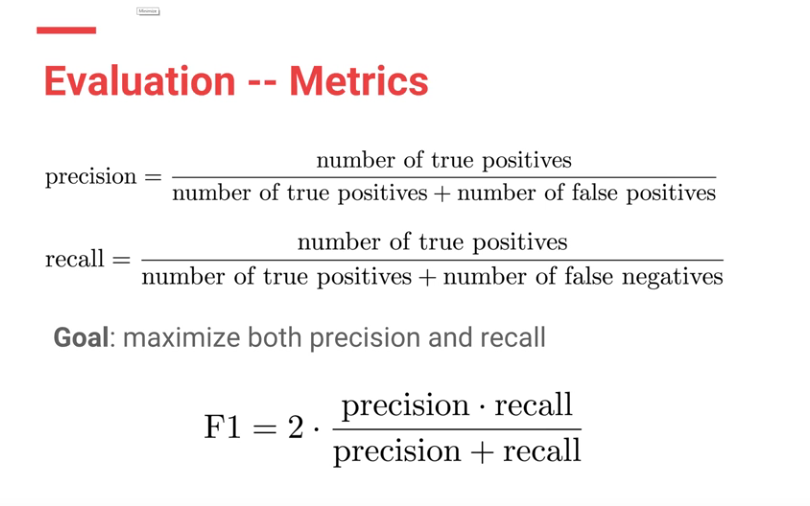
F1 scores were used to evaluate both CheXNet model and the Stanford Radiologists.
Calculating F1 score
Each Radiologists’ F1 score was calculated by considering the other three radiologists as “ground truth.” ChexNet’s F1 score, was calculated vs. all 4 radiologists. A bootstrap calculation was added to yield 95% confidence intervals.
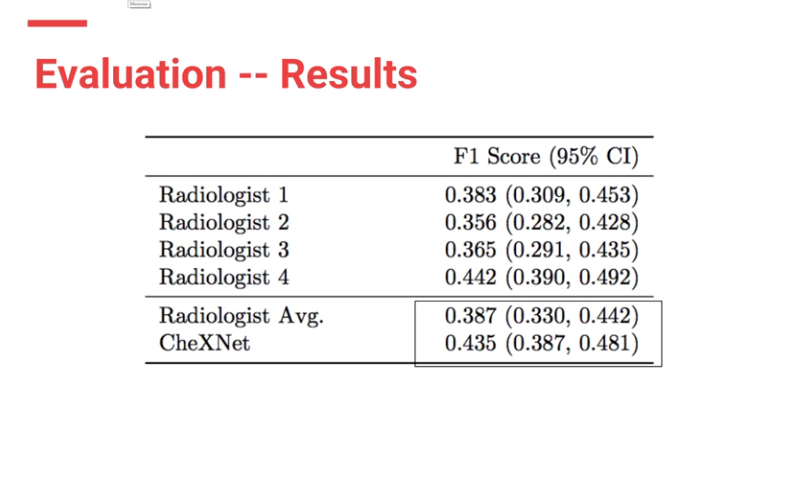
CheXnet’s results are as follows:
From the results, ChexNet outperforms human radiologists. The varying F1 scores can be interpreted to imply that for each study , 4 radiologists do not seem to agree with each other on findings. However there is an outlier (rad 4 — with an F score of 0.442) who is the thoracic trained radiologists who performs better than the ChexNet.
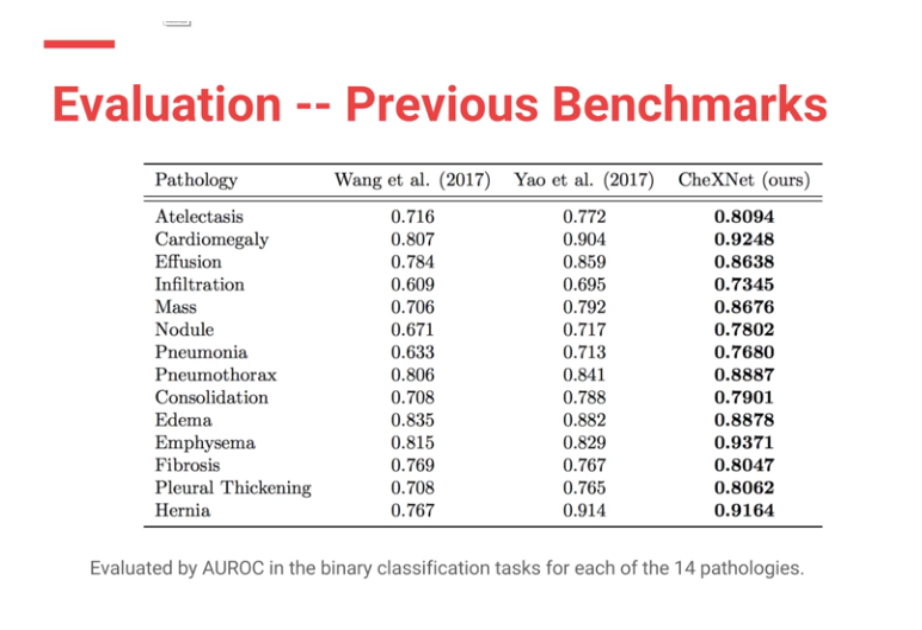
Moreover CheXNet has State of the Art (SOTA) performance on all 14 pathologies compared to prior publications.
In my (JG) search , the Machine Intelligence Lab, Institute of Computer Science & Technology, Peking University, directed by Prof. Yadong Mu reports superior performance than the Stanford group. The code is open source and available here — https://github.com/arnoweng/CheXNet
Results from various implementations of ChexNet
Results from various implementations of ChexNet
Critique — Various studies that assess cognitive fit show that human performance can be affected by lack of clinical information or prior comparisons that may affect their performance. Moreover, before the most recent version of the paper, human performance was unfairly scored against the machine.
Clinical significance
With the majority of labelled CXRs with pneumothorax having chest tubes present, the question must be raised: “are we training the Densenet to recognize pneumothoraces or chest tubes?”
Peer review
Luke Oakden-Rayner MD, a radiologist in Australia with expertise in AI & deep learning who was on our panel independently evaluated the ChestXRay-14 dataset, and CheXNet. He praises the Stanford team for their openness and patience in discussing the paper’s methodology, and their willingness to modify the paper to correct a methodologic flaw which biased against evaluating radiologists.
Summary
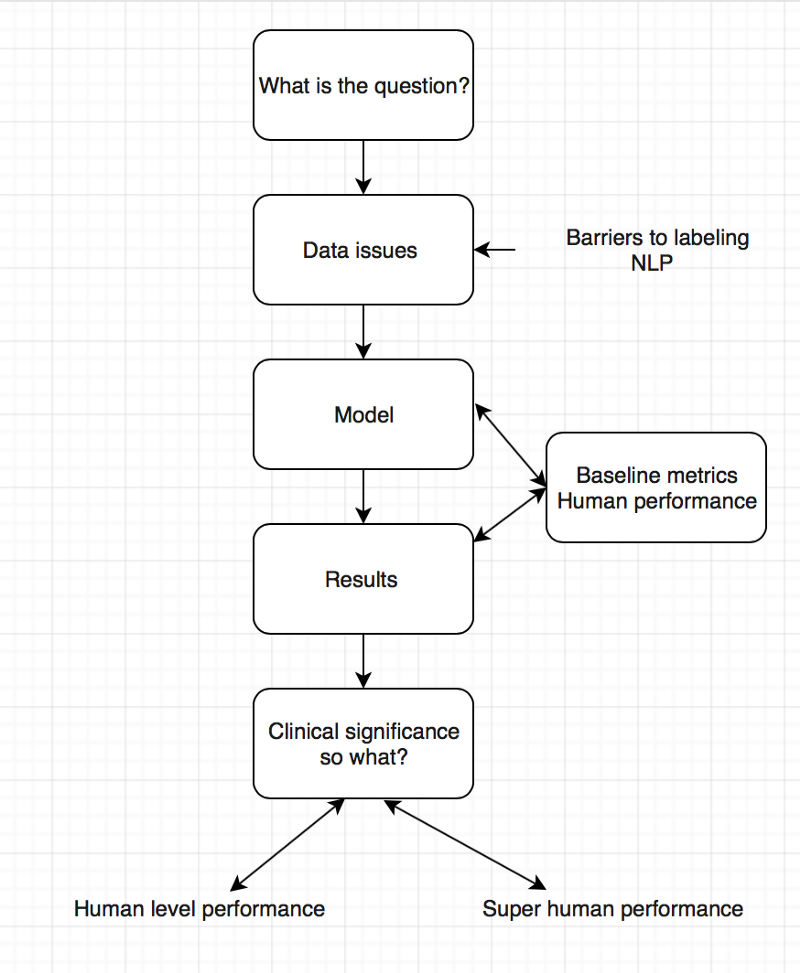
For the second AI journal club we analysed the pipeline of AI papers in medicine. You must make sure you are asking the right clinical question to be answered and not doing algorithms for the sake of doing something. Thereafter understand whether your data will help you answer the question you have, looking into details on how the data was collected and labeled.
To determine human level or super human performance, ensure the baseline metrics are adequate and not biased against one group.
Pipeline for AI in medicine
The model appears to give at-human performance for experts, or better than human performance for less-trained practitioners. This is in line with research findings and Enlitic’s experience. We should not be surprised by that; the research in Convolutional Neural Networks has consistently reported near-human or super-human performance consistently.
Take Aways
There is exists a critical gap in the labeling of medical data.
Do not forget the clinical significance of your results.
Embrace peer review especially in medicine and AI
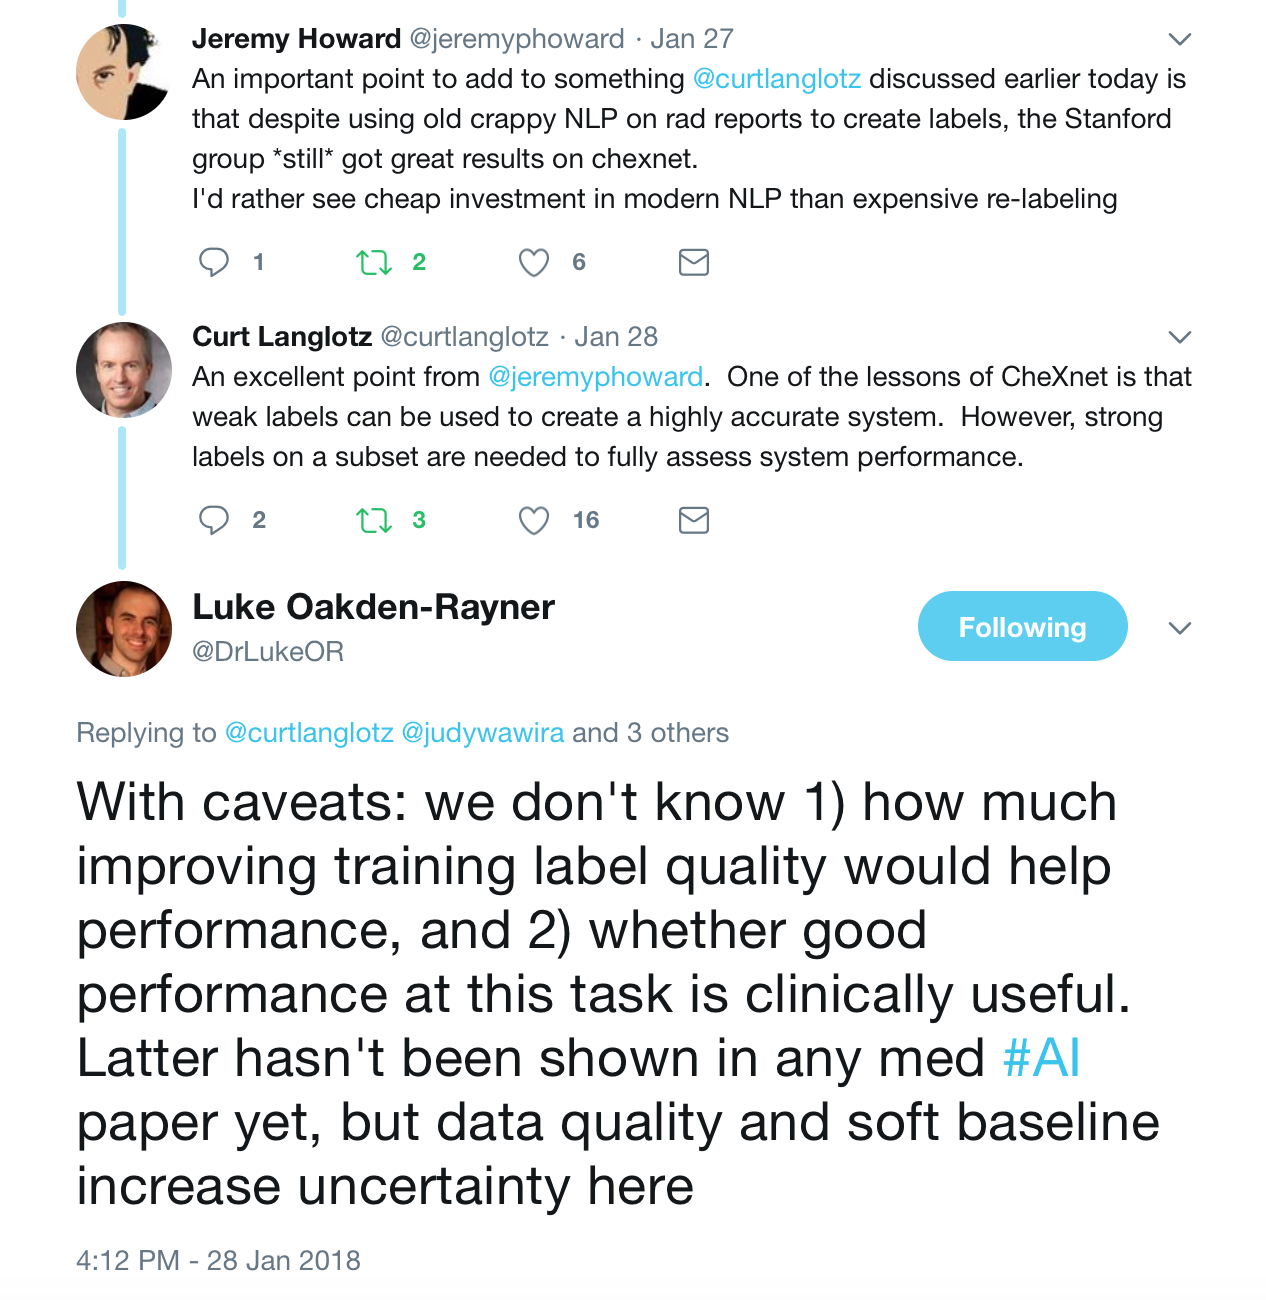
These were the best tweets regarding the problem of labeling medical data — aka do not get discouraged to attempt deep learning for medicine.
The journal club was a success, so if you are a doctor or an AI scientist , join us at https://tribe.radai.club to continue with the conversations on AI and medicine. You can listen to the recording of this journal club here : https://youtu.be/xoUpKjxbeC0 . Our next guest is Timnit Gebru who worked on US demographic household prediction using Google Street view images on 22nd February 2018. She will be talking on Using deep learning and Google Street View to estimate the demographic makeup of neighborhoods across the United States (http://www.pnas.org/content/114/50/13108).
Coming soon
For the journal club we developed a human versus AI competition for interepreting the CXRs in the dataset hosted at https://radai.club. We will be publishing the outcome of our crowdsourced labels soon, with a detailed analysis to check whether the model performance improves.
This article referred to Jeremy Howard (Ex-CEO of Kaggle) — updated to “president and chief scientist of Kaggle”
Article stated NLP performance on that dataset is not likely improved over random.Jeremy clarified that the precision of the normal finding was what was not likely improved over random
Consider aerial dogfighting. The human OODA loop is – Observe, Orient, Decide, Act. You want to “get inside your opponent’s OODA loop” and out-think them, knowing their actions before they do, assuring victory. If you know your opponent’s next move, you can anticipate where to shoot and end the conflict decisively. Quoting Sun Tzu in The Art of War:
If you know the enemy and know yourself, you need not fear the result of a hundred battles. If you know yourself but not the enemy, for every victory gained you will also suffer a defeat. If you know neither the enemy nor yourself, you will succumb in every battle.
Focused, directed, lengthy and perhaps exhausting training for a fighter pilot enables them to “know their enemy” and anticipate action in a high-pressure, high-stakes aerial battle. The penalty for failure is severe – loss of the pilot’s life. Physicians prepare similarly – a lengthy and arduous training process in often adverse circumstances. The penalty for failure is also severe – a patient’s death. Given adequate intelligence and innate skill, successful pilots and physicians internalize their decision trees – transforming the OODA loop to a simpler OA loop – Observe and Act. Focused practice allows the Orient and Decide portions of the loop to become automatic and intuitive, almost Zen-like. This is what some people refer to as ‘Flow’ – an effortlessly hyperproductive state where total focus and immersion in a task suspends the perception of the passage of time.
For a radiologist, ‘flow’ is when you sit down at your PACS at 8am, continuously reading cases, making one great diagnosis after another, smiling as the words appear on Powerscribe. You’re killing the cases and you know it. Then your stomach rumbles – probably time for lunch – you look up at the clock and it is 4pm. That’s flow.
Kahneman defines this as fast type 1 thinking, intuitive and heuristic : quick, easy, and with sufficient experience/training, usually accurate. But type 1 thinking can fail : a complex process masquerades as a simple one, additional important data is undiscovered or ignored, or a novel agent is introduced. In these circumstances type 2 critical thinking is needed : slow, methodological, deductive and logical. But humans err, substituting heuristic thinking for analytical thinking, and we get it wrong.
For the enemy fighter pilot, its the scene in Top Gun where Tom Cruise hits the air brakes to drop behind an attacking Mig to deliver a kill shot with his last missile. For a physician, it is an uncommon or rare disease presenting like a common one, resulting in a missed diagnosis and lawsuit.
To those experimenting in deep learning and Artificial intelligence, the time to train or teach the network far exceeds the time needed to process an unknown through the trained network. Training can take hours to days, evaluation takes seconds.
Narrow AI’s like Convolutional Neural Networks take advantage of their speed to go through the OODA loop quickly, in a process called inference. I suggest a deep learning algorithm functions as an OA loop on the specific type of data it has been trained on. Inference is quick.
I believe that OODA loops are Kahneman’s Type 2 slow thinking. OA loops are Kahneman’s Type 1 fast thinking. Narrow AI inference is a type 1 OA loop. An AI version of type 2 slow thinking doesn’t yet exist.*
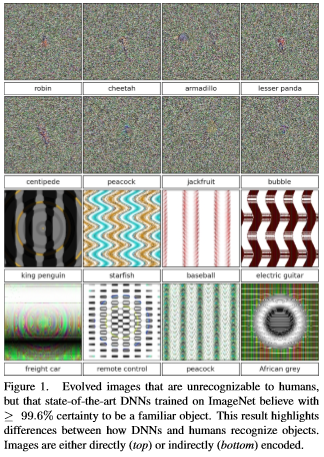
And like humans, Narrow AI can be fooled.
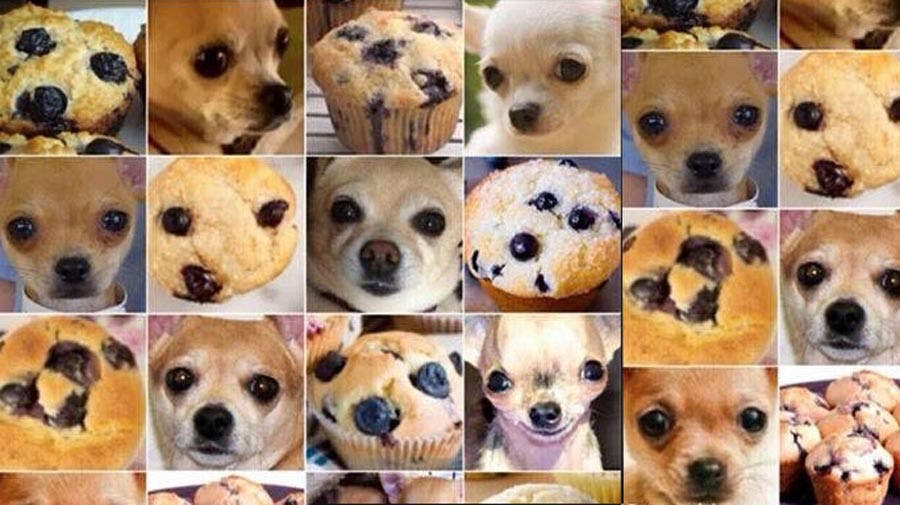
If you haven’t seen the Chihuahua vs. blueberry muffin clickbait picture, consider yourself sheltered. Claims that narrow AI can’t tell the difference are largely, but not entirely, bogus. While Narrow AI is generally faster than people, and potentially more accurate, it can still make errors. But so can people. In general, classification errors can be reduced by creating a more powerful, or ‘deeper’ network. I think collectively we have yet to decide how much error to tolerate in our AI’s. If we are willing to tolerate an error of 5% in humans, are we willing to tolerate the same in our AI’s, or do we expect 97.5%? Or 99%? Or 99.9%?
Selecting and perturbing a single pixel is much more subtle, and probably could escape human scrutiny. Jaiwei Su et al address this in their “One Pixel Attack” paper, where the modification of one pixel in an image had between a 66% to 73% chance of changing the classification of that image. By changing more than one pixel, success rates respectively rose. The paper used older, less deep Narrow AI’s like VGG-16 and Network-in-network. Newer models such as DenseNets and ResNets might be harder to fool. This type of “attack” represents a real-world situation where the OA loop fails to account for unexpected new (or perturbed) information, and is incorrect.
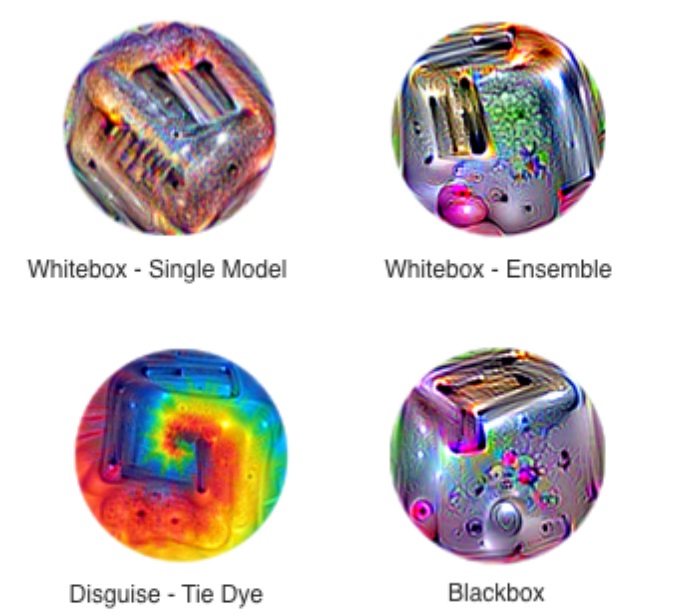
Contemporaneous update: Google has developed images that use an adversarial attack to uniformly defeat classification attempts by standard CNN models. By making “stickers” out of these processed images, the presence of such an image, even at less than 20% of the image size, is sufficient to change the classification to what the ensemble dictates, rather than the primary object in an image. They look like this:
https://arxiv.org/pdf/1712.09665.pdf
I am not aware of defined solutions to these problems – the obvious images that fool the classifier can probably be dealt with by ensembling other, more traditional forms of computer vision image analysis such as HOG or SVM’s. For a one-pixel attack, perhaps widening the network and increasing the number of training samples by either data augmentation or adversarially generated features might make the network more robust. This probably falls into the “too soon to tell” category.
There has been a great deal of interest and emphasis placed lately on understanding black-box models. I’ve written about some of these techniques in other posts. Some investigators feel this is less relevant. However, by understanding how the models fail, they can be strengthened. I’ve also written about this, but from a management standpoint. There is a trade off between accuracy at speed, robustness, and serendipity. I think the same principle applies to our AI’s as well. By understanding the frailty of speedy accuracy vs. redundancies that come at the expense of cost, speed, and sometimes accuracy, we can build systems and processes that not only work but are less likely to fail in unexpected & spectacular ways.
Let’s acknowledge the likelihood of failure of narrow AI where it is most likely to fail, and design our healthcare systems and processes around that, as we begin to incorporate AI into our practice and management. If we do that, we will truly get inside the OODA loop of our opponent – disease – and eradicate it before it even had a chance. What a world to live in where the only thing disease can say is, “I never saw it coming.”
*I believe OODA loops have mathematical analogues. The OODA loop is inherently Bayesian – next actions iteratively decided by prior probabilities. Iterative deep learning constructs include LSTM and RNN’s (Recurrent Neural Networks) and of course, General Adversarial Networks (GANs). There have been attempts to not only use Bayesian learning for hyperparameter optimization but also combining it with RL(Reinforcement Learning) & GANs. Time will only tell if this brings us closer to the vaunted AGI (Artificial General Intelligence)**.
**While I don’t think we will soon solve the AGI question, I wouldn’t be surprised if complex combinations of these methods, along with ones not yet invented, bring us close to top human expert performance in a Narrow AI. But I also suspect that once we start coding creativity and resilience into these algorithms, we will take a hit in accuracy as we approach less narrow forms of AI. We will ultimately solve for the best performance of these systems, and while it may even eventually exceed human ability, there will likely always be an error present. And in that area of error is where future medicine will advance.
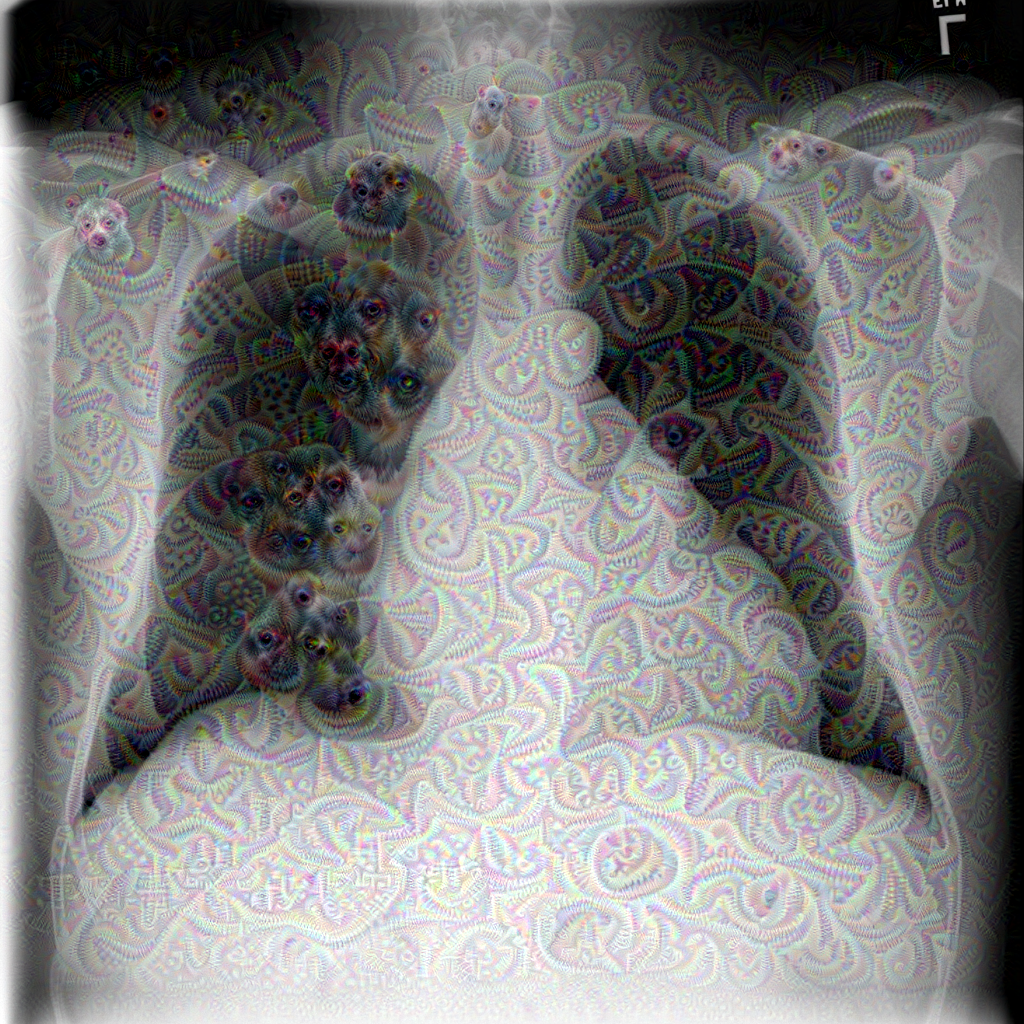
Chest Radiograph from ChestX-ray14 dataset processed with the deep dream algorithm trained on ImageNet
1/25/18: NOTE: Since the November release of the CheXNet paper on ArXiV, there has been a healthy and extensive online discussion on twitter, reddit, and online blogs. The Stanford paper has undergone at least two revisions with some substantial modifications, most importantly the replacement of ROC curves with F1 scores and a bootstrap calculation of significance. Some details about the methodology which were not released in the original version have come out, particularly the “re-labeling” of ground truth by Stanford radiologists. My comment about the thoracic specialist has completely borne out on further release of information. And the problems with ChestXRay14’s labeling (why the Stanford docs re-labeled) are now well-known.
The investigation and discussion of this paper has been spearheaded by Luke Oaken Rayner, who has spent months corresponding with the author and discussing the paper. For further Information, see below.
The discussion on CheXNet appears to be over, and there has been a great deal of collective learning in it. The Stanford group should be lauded for their willingness to engage in open peer review and modify their paper substantially after it. There is no question that a typical 18-24 month process of review and discussion was fast-tracked in the last two months. Relevant blog links are below after my December addendum. This will be my last update on this post, as it is “not so brief” any longer!
First off, from the Machine Learning perspective, methodologies check out. It uses a 121 layer DenseNet, which is a powerful convolutional neural network. While code has not yet been provided, the DenseNet seems similar to code repositories online where 121 layers are a pre-made format. 80/20 split for Training/Validation seems pretty reasonable (from my friend, Kirk Borne), Random initialization, minibatches of 16 w/oversampling positive classes, and a progressively decaying validation loss are utilized, all of which are pretty standard. Class activation mappings are used to visualize areas in the image most indicative of the activated class (in this case, pneumonia). This is an interesting technique that can be used to provide some human-interpretable insights into the potentially opaque DenseNet.
The last Fully Connected (FC) layer is replaced by a single output (only one class is being tested for – pneumonia) coupled to a sigmoid function (an activation function – see here) to give a probability between 0 and 1. Again, pretty standard for a binary classification. The multiclass portion of the study was performed seperately/later.
The test portion of the study was 420 Chest X-rays read by four radiologists, one of whom was a thoracic specialist. They could choose between the 14 pathologies in the ChestX-ray14 dataset, read blind without any clinical data.
So, a ROC curve was created, showing three radiologists similar to each other, and one outlier.The radiologists lie slightly under the ROC curve of the CheXNet classifier. But, a miss is as good as a mile, so the claims of at or above radiologist performance are accurate, because math. As Luke Oakden Rayner points out, this would probably not pass statistical muster.
So that’s the study. Now, I will pick some bones with the study.
First, only including one thoracic radiologist is relevant, if you are going to make ground truth agreement of 3 out of four radiologists. (Addendum: And, for statistical and methodological reasons discussed online, the 3 out of 4 implementation was initially flawed as scored) General radiologists will be less specific than specialist radiologists, and that is one of the reasons why we have moved to specialty-specific reads over the last 20 years. If the three general rads disagreed with the thoracic rad, the thoracic rad’s ground truth would be discarded. Think about this – you would take the word of the generalist over the specialist, despite greater training. (1/25 Addendum: proven right on this one. The thoracic radiologist is an outlier with a higher F1 score) Even Google didn’t do this in their retinal machine learning paper. Instead, Google used their three retinal specialists as ground truth and then looked at how the non-specialty opthalmologists were able to evaluate that data and what it meant to the training dataset. (Thanks, Melody!) Nevertheless, all rads lie reasonably along the same ROC curve, so methodologically it checks outthe radiologists are likely of equal ability but different sensitivities/specificities.
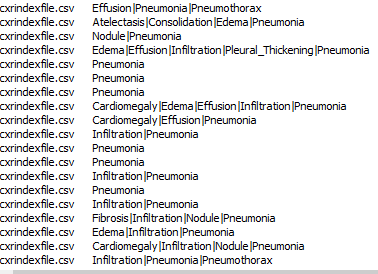
Second, the Wang ChestXray14 dataset is a dataset that was data-mined from NIH radiology reports. This means that for the dataset, ground truth was whatever the radiologists said it was. I’m not casting aspersions on the NIH radiologists, as I am sure they are pretty good. I’m simply saying that the dataset’s ground truth is what it says it is, not necessarily what the patient’s clinical condition was. As proof of that, here are a few cells from the findings field on this dataset.
In any case, the NIH radiologists more than a few times perhaps couldn’t tell either, or identified one finding as the cause of the other (Infiltrate & Pneumonia mentioned side by side) and at the top you have the three fields “atelectasis” “consolidation” & “Pneumonia” – is this concurrent pneumonia with consolidation with some atelectasis elsewhere, or is it “atelectasis vs consolidation cannot r/o pneumonia” (as radiologists we say these things). While the text miner purports to use several advanced NLP tools to avoid these kinds of problems, in practice it does not seem to do so. (See addendum below, further addendum, confirmed by Jeremy Howard) Dr. Ng, if you read this, I have the utmost respect for you and your team, and I have learned from you. But I would love to know your rebuttal, and I would urge you to publish those results. Or perhaps someone should do it for reproducibility purposes.
Finally, I’m bringing up these points not to be a killjoy, but to be balanced. I think it is important to see this and prevent someone from making a really boneheaded decision of firing their radiologists to put in a computer diagnostic system (not in the US, but elsewhere) and realizing it doesn’t work after spending a vast sum of money on it. Startups competing in the field who do not have deep healthcare experience need to be aware of potential pitfalls in their product. I’m saying this because real people could be really hurt and impacted if we don’t manage this transition into AI well. Maybe all parties involved in medical image analysis should join us in taking the Hippocratic Oath, CEO’s and developers included.
Thanks for reading, and feel free to comment here or on twitter or connect on linkedin to me: @drsxr
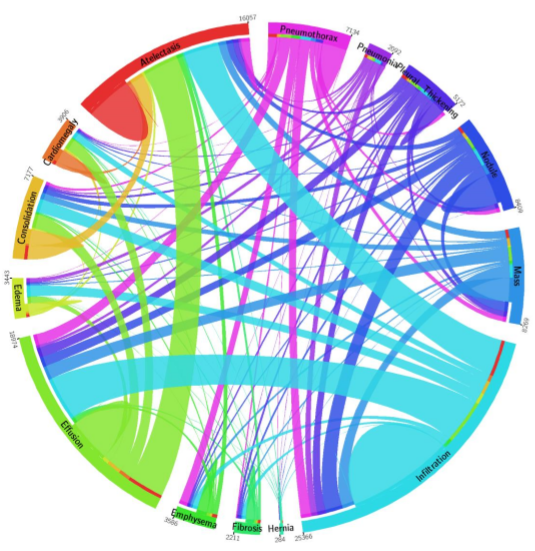
December Addendum: ChestX-ray14 is based on the ChestX-ray8 database which is described in a paper released on ArXiv by Xiaosong Wang et al. The text mining is based upon a hand-crafted rule-based parser using weak labeling designed to account for “negation & uncertainty”, not merely application of regular expressions. Relationships between multiple labels are expressed, and while labels can stand alone, for the label ‘pneumonia’, the most common associated label is ‘infiltrate’. A graph showing relationships between the different labels in the dataset is here (from Wang Et Al.)
Pneumonia is purple with 2062 cases, and one can see the largest association is with infiltration, then edema and effusion. A few associations with atelectasis also exist (thinner line).
The dataset methodology claims to account for these issues at up to 90% precision reported in ChestX-ray8, with similar precision inferred in ChestX-ray14.
“No Findings”
“No Findings”
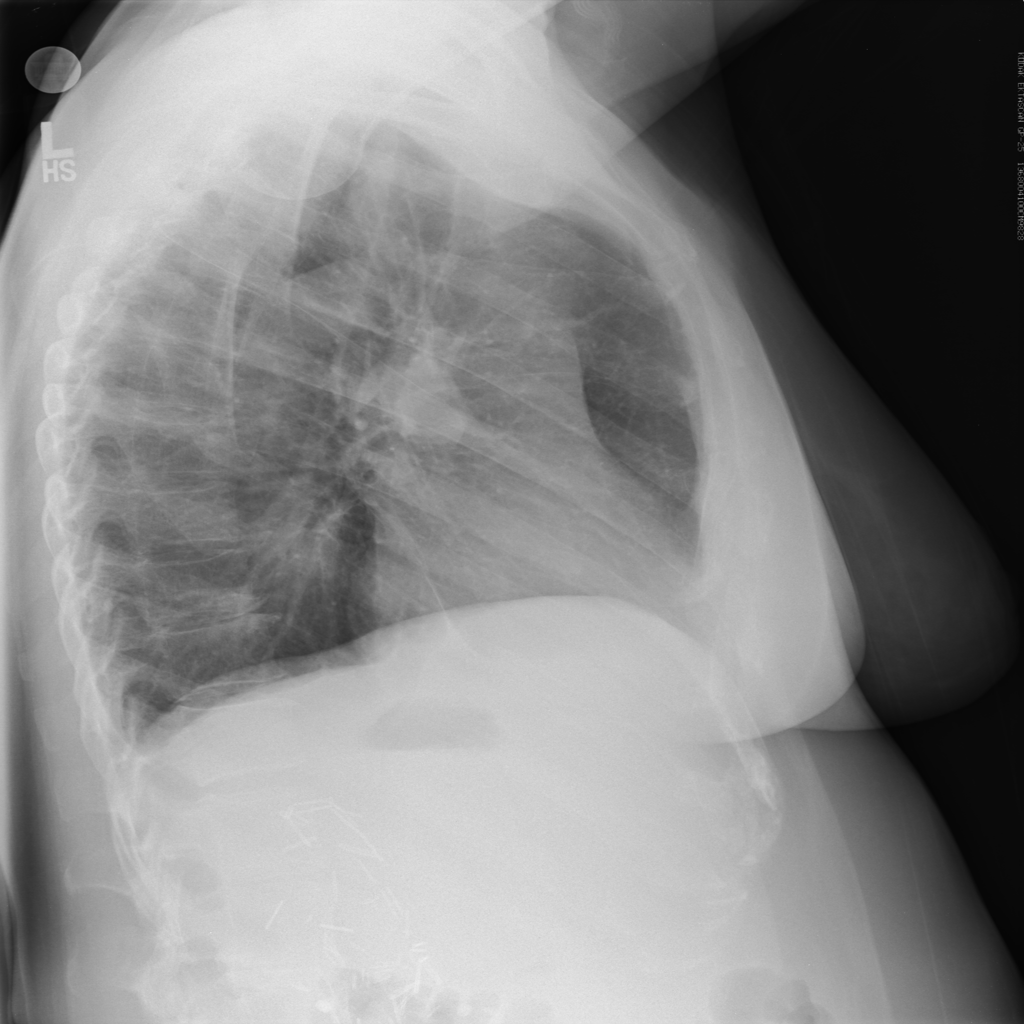
However, expert review of the dataset (ChestX-ray14) does not support this. In fact, there are significant concerns that the labeling of the dataset is a good deal weaker. I’ll just pick out two examples above that show a patient likely post R lobectomy with attendant findings classified as “No Findings” and the lateral chest X-ray which doesn’t even belong in the study database of all PA and AP films. These sorts of findings aren’t isolated – Dr. Luke Oakden-Rayner addresses this extensively in this post, from which his own observations are garnered below:
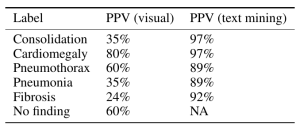
Dr. Luke Oakden Rayner’s own Positive Predictive Value on visual inspection of 130 images vs reported
His final judgment is that the ChestX-ray14 dataset is not fit for training medical AI systems to do diagnostic work. He makes a compelling argument, but I think it is primarily a labelling problem, where the proposed 90% acccuracy on the NLP data mining techniques of Wang et al does not hold up. ChestX-ray14 is a useful dataset for the images alone, but the labels are suspect. I would call upon the NIH group to address this and learn from this experience. In that light, I am surprised that the system did not do a great deal better than the human radiologists involved in Dr. Ng’s group’s study, and I don’t really have a good explanation for it.
The evaluation of CheXNet by these individuals should be recognized:
This post is cross posted to www.ai-imaging.org . For machine learning and AI issues, please visit the new site!
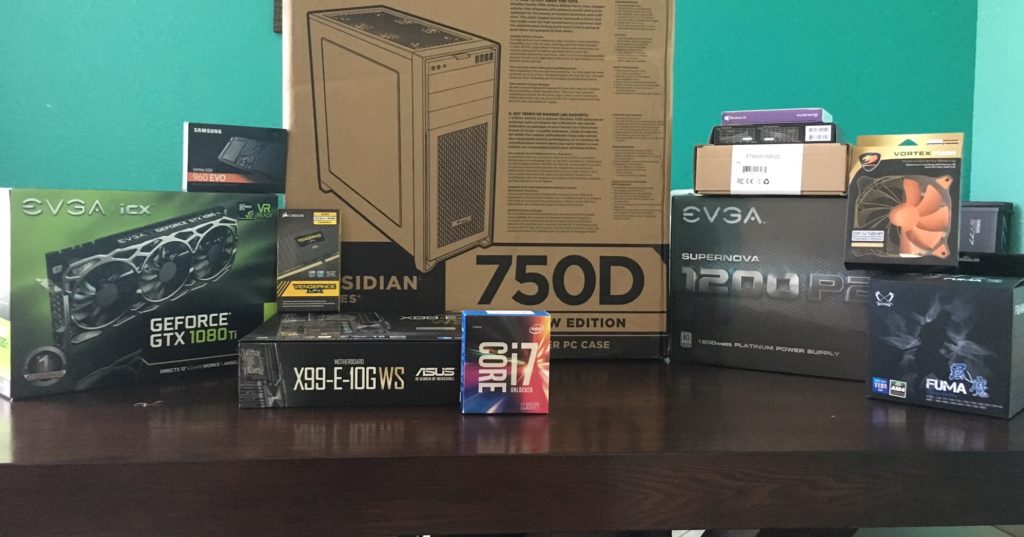
With Tensorflow released to the public, the NVidia Pascal Titan X GPU, along with (relatively) cheap storage and memory, the time was right to take the leap from CPU-based computing to GPU accelerated machine learning.
My venerable Xeon W3550 8GB T3500 running a 2GB Quadro 600 was outdated. Since a DGX-1 was out of the question ($129,000), I decided to follow other pioneers building their own deep learning workstations. I could have ended up with a multi-thousand dollar doorstop – fortunately, I did not.
Criteria:
Reasonably fast CPU
Current ‘Best’ NVidia GPU with large DDR5 memory
Multi-GPU potential
32GB or more stable RAM
SSD for OS
Minimize internal bottlenecks
Stable & Reliable – minimize hardware bugs
Dual Boot Windows 10 Pro & Ubuntu 16.04LTS
Can run: R, Rstudio, Pycharm, Python 3.5, Tensorflow
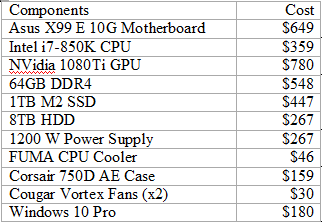
Total: $3725
Asus X99 E 10G WS Motherboard. Retail $699
A Motherboard sets the capabilities and configuration of your system. While newer Intel Skylake and Kaby Lake CPU architectures & chipsets beckon, reliability is important in a computationally intensive build, and their documented complex computation freeze bug makes me uneasy. Also, both architectures remain PCIe 3.0 at this time.
Therefore, I chose the ASUS X99 motherboard. The board implements 40 PCIe 3.0 lanes which will support three 16X PCIe 3.0 cards (i.e. GPU’s) and one 8x card. The PCIe 3.0-CPU lanes are the largest bottleneck in the system, so making these 16X helps the most. It also has a 10G Ethernet jack somewhat future-proofing it as I anticipate using large datasets in the Terabyte size. It supports up to 128GB of DDR4. The previous versions of ASUS X99 WS have been well reviewed.
Intel Core i7 6850K Broadwell-E CPU Socket Retail $649
Socket LGA2011-v3 on the motherboard guides the CPU choice – the sweet spot in the Broadwell-E lineup is the overclockable 3.6Ghz 6850K with 6 cores and 15MB of L3 cache, permitting 40 PCIe lanes. $359 discounted is attractive compared to the 6900K, reviewed to offer minimal to no improvement at a $600 price premium. The 6950X is $1200 more for 4 extra cores, unnecessary for our purposes. Avoid the $650 6800K – pricier and slower with less (28) lanes. A stable overclock to 4.0Ghz is easily achievable on the 6850K.
Last year, choosing a GPU was easy – the Titan X Pascal, a 12GB 3584 CUDA-core monster. However, by spring 2017 there were two choices: The Titan Xp, with slightly faster memory speed & internal bus, and 256 more CUDA cores; and the 1080Ti, the prosumer enthusiast version of the Titan X Pascal, with 3584 cores. The 1080Ti differs in its memory architecture – 11GB DDR5 and a slightly slower, slightly narrower bandwidth vs. the Xp.
The 1080Ti currently wins on price/performance. You can buy two 1080Ti’s for the price of one Titan Xp. Also, at time of purchase, Volta architecture was announced. As the PCIe bus is the bottleneck, and will remain so for a few years, batch size into DDR5 memory & CUDA cores will be where performance is gained. A 16GB DDR5 Volta processor would be a significant performance gain from a 12GB Pascal for deep learning. Conversely, 12GB Pascal to 11GB Pascal is a relative lesser performance hit. As I am later in the upgrade cycle, I’ll upgrade to the 16GB Volta and resell my 1080Ti in the future – I anticipate only taking a loss of $250 per 1080Ti on resell.
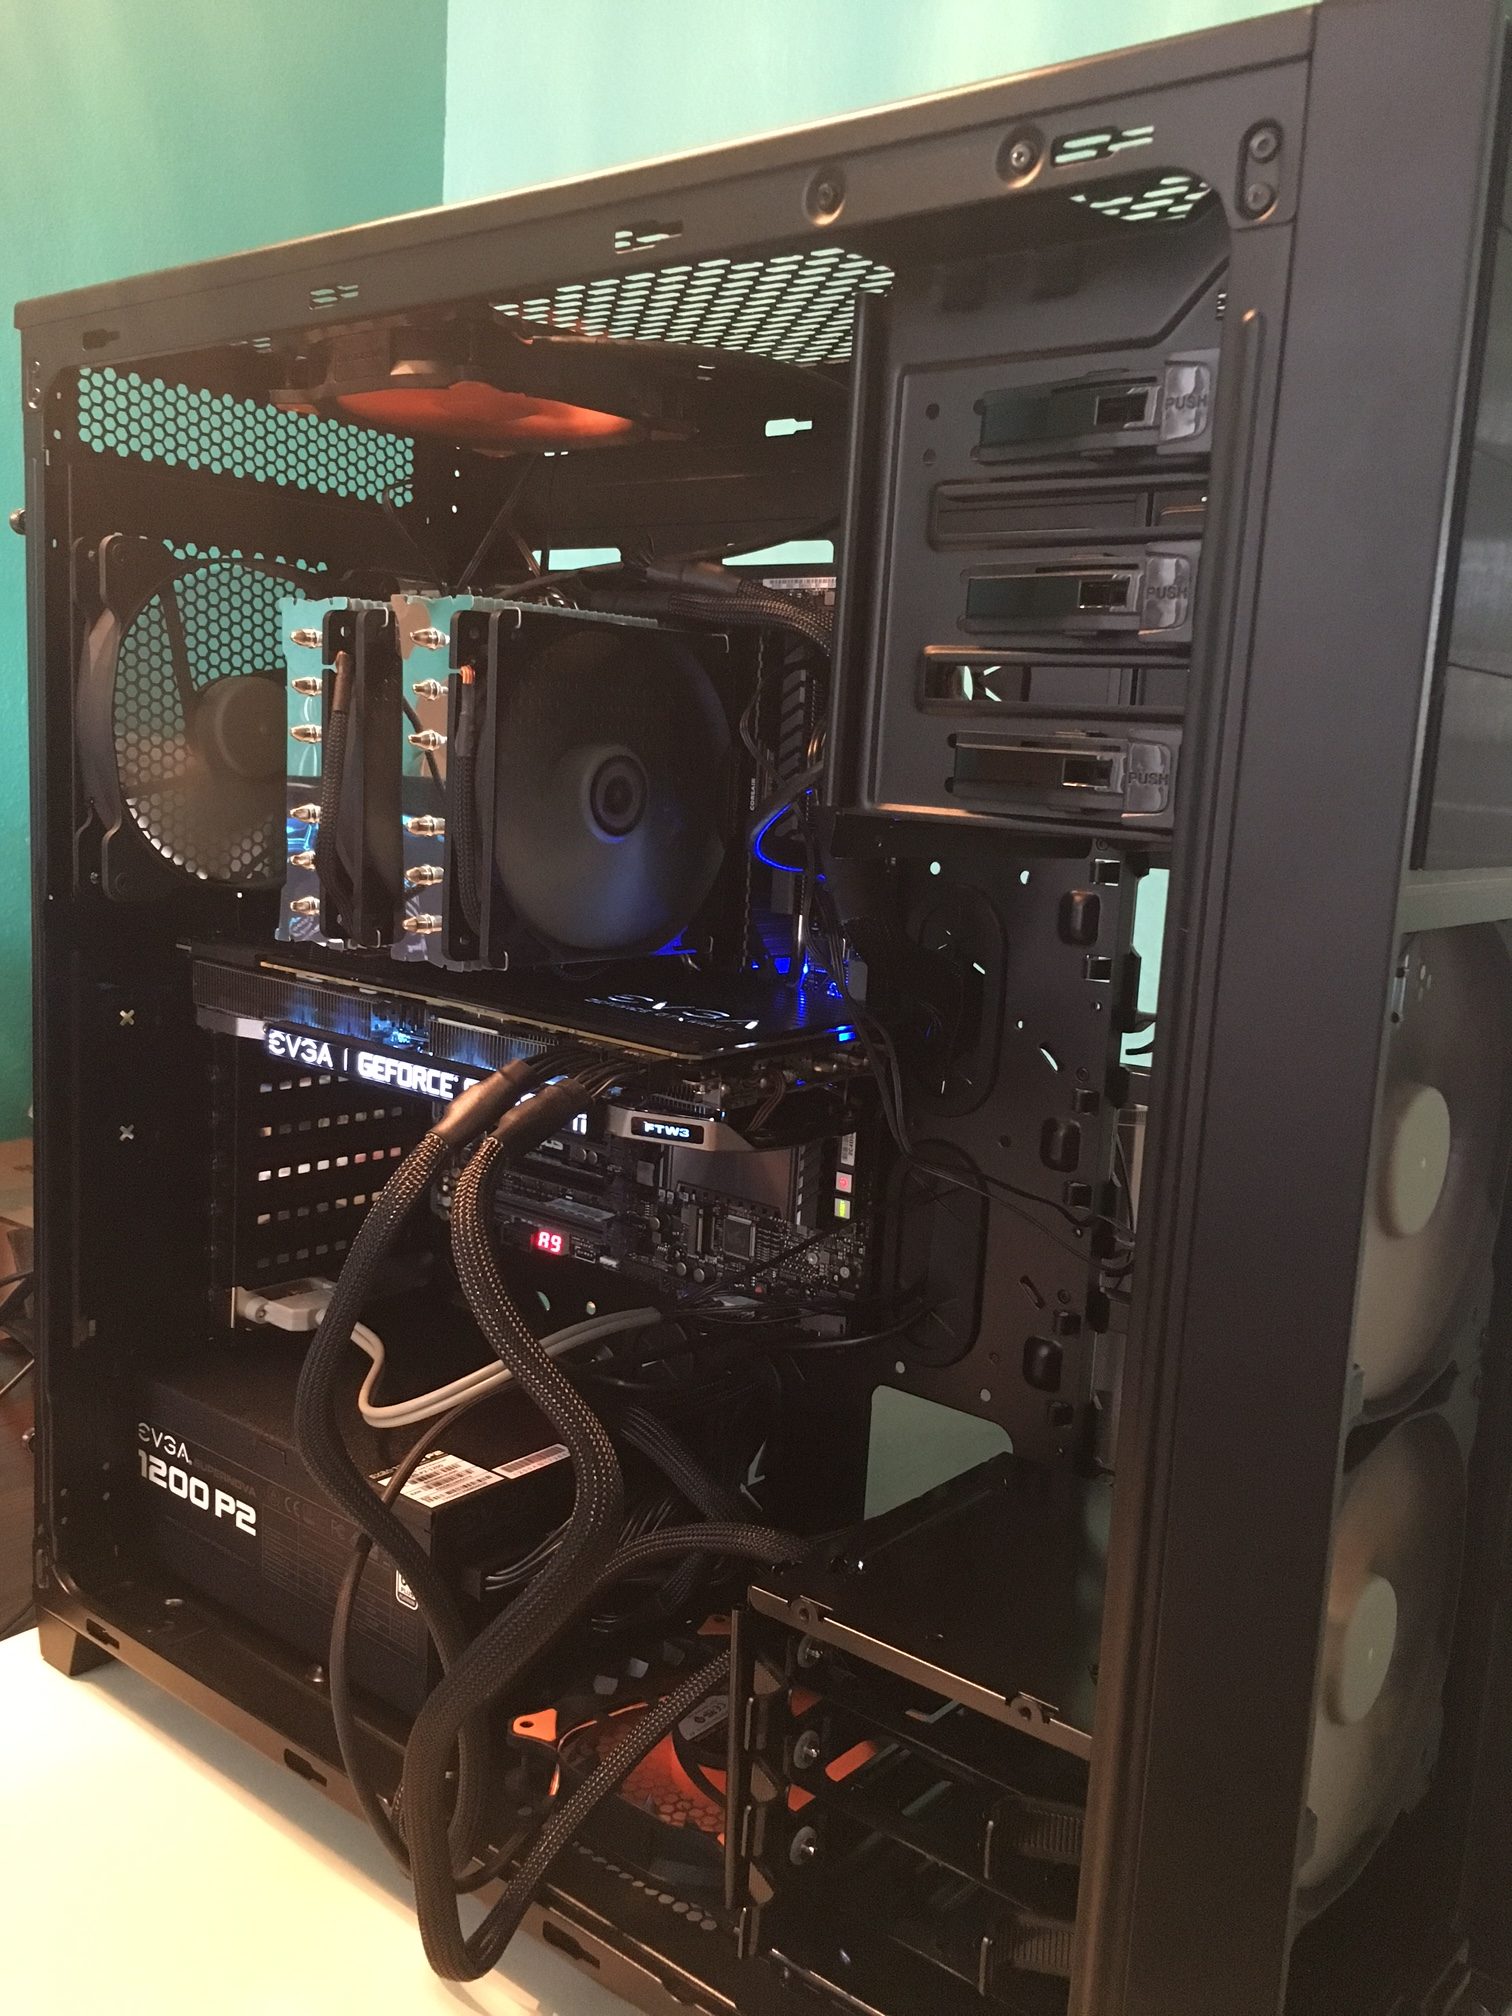
The FTW3 edition was chosen because it is a true 2-slot card (not 2.5) with better cooling than the Founder’s Edition 1080Ti. This will allow 3 to physically fit onto this motherboard.
DDR4 runs at 2133mhz unless overclocked. Attention must be paid to the size of the DRAM units to ensure they fit under the CPU cooler, which these do. From my research, DRAM speeds over 3000 lose stability. For Broadwell there’s not much evidence that speeds above 2666mhz improves performance. I chose 64GB because 1) I use R which is memory resident so the more GB the better and 2) There is a controversial rule of thumb that your RAM should equal 2x the size of your GPU memory to prevent bottlenecks. Implementing 3 1080Ti’s, 3x 11GB = 33 GB. Implementing 2 16GB Voltas would be 32GB.
Samsung 1TB 960 EVO M2 NVMe SSD Retail $500
The ASUS motherboard has a fast M2 interface, which, while using PCIe lanes, does not compete for slots or lanes. The 1TB size is sufficient for probably anything I will throw at it (all apps/programs, OS’s, and frequently used data and packages. Everything else can go on other storage. I was unnecessarily concerned about SSD heat throttling – on this motherboard, the slot’s location is in a good place which allows for great airflow over it. The speed in booting up Windows 10 or Ubuntu 16.04 LTS is noticeable.
EVGA Titanium 1200 power supply Retail $350
One of the more boring parts of the computer, but for a multi GPU build you need a strong 1200 or 1600W power supply. The high Titanium rating will both save on electricity and promote stability over long compute sessions.
Barracuda 8TB Hard Drive Retail $299
I like to control my data, so I’m still not wild about the cloud, although it is a necessity for very large data sets. So here is a large, cheap drive for on-site data storage. For an extra $260, I can Raid 1 the drive and sleep well at night.
Strike FUMA CPU Cooler. Retail $60
This was actually one of the hardest decisions in building the system – would the memory will fit under the fans? The answer is a firm yes. This dual fan tower cooler was well-rated, quiet, attractive, fit properly, half the price of other options, and my overclocked CPU runs extremely cool – 35C with full fan RPM’s, average operating temperature 42C and even under a high stress test, I have difficulty getting the temperature over 58C. Notably, the fans never even get to full speed on system control.
Corsair 750 D Airflow Edition Case. Retail $250
After hearing the horror stories of water leaks, I decided at this level of build not to go with water cooling. The 750D has plenty of space (enough for a server) for air circulation, and comes installed with 3 fans – two air intake on the front and one exhaust at upper rear. It is a really nice, sturdy, large case. My front panel was defective – the grating kept falling off – so Corsair shipped me a replacement quickly and without fuss.
Cougar Vortex 14” fans – Retail $20 ea.
Two extra cougar Vortex 14” fans were purchased, one as an intake fan at the bottom of the case, and one as a 2nd exhaust fan at the top of the case. These together create excellent airflow at noise levels I can barely hear. Two fans on the CPU Heat Sink plus Three Fans on the GPU plus five fans on the case plus one in the power supply = 11 fans total! More airflow at lower RPM = silence.
Windows 10 Pro USB edition Retail $199
This is a dual boot system so, there you go.
Specific limitations with this system are as follows. While it will accept four GPU’s physically, the slots are limited to 16X/16X/16X/8X with the M2 drive installed which may affect performance on the 4th GPU (& therefore deep learning model training and performance). Additionally, the CPU upgrade path is limited – without going to a Xeon, the only reasonable upgrade from the 6850K’s 14,378 passmark is the 6950X, with a passmark of 20,021. In the future if more than 128GB DDR4 is required, that will be a problem with this build.
Finally, inherent bandwidth limitations exist in the PCIe 3.0 protocol and aren’t easily circumvented. PCIe 3.0 throughput is 8GB/s. Compare this to NVidia’s proprietary NVlink that allows throughput of 20-25GB/s (Pascal vs. Volta). Note that current NVlink speeds will not be surpassed until PCIe5.0 is implemented at 32GB/s in 2019. NVidia’s CUDA doesn’t implement SLI, either, so at present that is not a solution. PCIe 4.0 has just been released with only IBM adopting, doubling transfer vs. 3.0, and 5.0 has been proposed, doubling yet again. However, these faster protocols may be difficult and/or expensive to implement. A 4 slot PCIe 5.0 bus will probably not be seen until into the 2020’s. This means that for now, dedicated NVlink 2.0 systems will outperform similar PCIe systems.
With that said, this system approaches a best possible build considering price and reliability, and should be able to give a few years of good service, especially if the GPU’s are upgraded periodically. Precursor systems based upon the Z97 chipset are still viable for deep learning, albeit with slower speeds, and have been matched to older NVidia 8GB 1070 GPU’s which are again half the price of the 1080Ti.
In part II, I will describe how I set up the system configuration for dual boot and configured deep learning with Ubuntu 16.04LTS. Surprisingly, this was far more difficult than the actual build itself, for multiple reasons I will explain & detail with the solutions. And yes, it booted up. On the first try.
If you liked this post, head over to our sister site, ai-imaging.org where part 2, part 3, and part 4 of this post are located.
It’s been almost a year since my last long-form article. Of course, ‘busyness’ in real life and blog writing are inversely proportional! I’ve been focused on real-life advances; namely neural networks, machine learning, and machine intelligence which fall loosely under the colloquial misnomer of “A.I.”
After a deep dive into machine learning, it is contemporaneously unexpectedly simple and deceptively difficult. The technical hurdles are significant, but improving – math skills ease the conceptual framework, but without the programming chops, practical application is tougher. Worse, the IT task of getting multiple languages, packages, and pieces of hardware to work together well is daunting. Getting the venerable MNIST to work on your computer with your GPU might be a weekend project – or worse. I’m not a ‘gamer’, so for the last decade it has been hard for me to get excited about increasing CPU clock speeds, faster DRAM, and faster GPU flops. Like many, I’ve been happy to use OSX on increasingly venerable Mac products – works fine for my purposes.
But since Alexnet’s publication in 2014, the explosion in both theory and application in machine learning has made me sit up and take notice. The Imagenet Large Scale Visual Recognition Challenge top-5 classification error rate was only 2.7% in latest competition held a few days ago in July 2017. That’s up from 30%+ error rates only four years ago. And my current hardware isn’t up to that task.
So, count me in. Certainly AI will be used in healthcare, but in what manner and to what extent still to be worked out. Pioneer firms like Arterys and Zebra Medical Vision, brave uncharted regulatory waters, watched closely by AI startups with similar dreams.
So, while I’d like to talk more about AI, I’m not sure that N2Value is the right place to do it. N2Value is primarily a healthcare thought leadership blog, promoting an evolution from Six Sigma methodology into more robust management practices which incorporate systems theory, focus on appropriately chosen metrics, model patient populations and likely outcomes and thereby successfully implement profitable value-based care. Caveat: with current US politics, it is very difficult to predict healthcare policy’s direction.
So, in the near future, I will decide what the scope of N2Value is to be going forward. I thank my loyal readers & subscribers who have given me 5 digit page views over the short life of the blog – far more than I ever expected! The blog has been a labor of love, but I’m pretty sure that AI algorithms have a place in healthcare management. However, I am not sure if you want to hear me opine on which version of convolutional neural network works better with or without LSTM added here, so stay tuned!
I have a few topics I have eluded to which I would like to mention quickly as stubs – they may or may not be expanded in the future.
The main point of this series was to document the chronological implications of advances in computing technology on a leading industry (finance), to describe the likely similar path of a lagging industry (healthcare). I never was able to find the statistics on Wall Street employment I was seeking, which would document a declining number of workers, while documenting higher productivity and profitability per employee as IT advances allowed for super-empowerment of individuals.
Additionally, it raised issues regarding technology in B2B relationships that are adversarial. Much like Insurer-Hospital or Hospital-Doctor. If I have time, I’d like to rewrite this series. It was when I first began blogging and it is a bit rough.
One of my favorite articles (with its siblings), this subject was addressed much more eloquently on the Ribbonfarm blog by David Manheim in Goodhart’s Law and why measurement is Hard. If anything, after reading that essay, you will have sympathy for the metrics-oriented manager and be convinced that nothing they can do is right. I firmly believe that metrics should be designed to the task at hand, and then once achieved, monitored for a while but not dogmatically so. Better to target new and improved metrics than enforce institutional petrification ‘by the numbers.’
I perceive the only way for value based care to be long-term profitable/successful is for large-scale vertical integration by a large Enterprise Health Institution (EHI) across the care spectrum. Hospital acquires Clinics, Practices, and Doctors, quantifies its covered lives, and then with better analytics than the insurers, capitates, ultimately contracting directly with employers & individuals. The insurers become redundant – and the Vertically Integrated Enterprise saves on economies of scale. It provides care in the most cost effective manner possible & closes beds, relying instead on telehealth, m health apps & predictive algorithms, and innovative care delivery.
When the Hospital’s profitability model resembles the insurer’s, and it is beholden only to itself (capitated payments are all there is), something fascinating happens. No longer does it matter if there is an ICD-10/HOPPS/CPT/DRG code for a procedure. The entity is no longer beholden to the rules of payment, and can internally innovate. A successful vertically integrated enterprise will – and quickly. While there will have to be appropriate regulatory oversight to prevent patient abuse, profiteering, or attempts to financialize the model; adjusting capitation with incentive payments for real measures of quality (not proxies) will prompt compliance and improved care.
Writing as a physician, this arrangement may or may not commoditize care further. Concerns about standardization of care are probably overstated, as the first CDS tool more accurate than a physician will standardize care to that model anyway! From an administrator’s perspective, it is a no-brainer to deliver care in an innovative manner that circumvents existing stumbling blocks. From a patient’s perspective, while I prefer easy access to a physician, maintaining that access is becoming unaffordable, let alone then utilizing health care! At some point, the economic pain will be so high that patients will want alternatives they can afford. Whether that means mid-levels or AI algorithms only time will tell.
I really like the concept I began here with data visualization in five dimensions. Could this be a helpful additional tool to AI research like Tensorboard? I’m thinking about eventually writing a paper on this one.
The concept of treating a care model like an equation is what got me started on all this – describing a system as a mathematical model seemed like such a good idea – but required learning on my part. That, and the effects thereof, are still ongoing. At the time of the writing, the solution appeared daunting & I “put the project on the back burner (i.e. abandoned it)” as I couldn’t make it work. Of course, with advancing tools and algorithms well suited to evaluation of this task, I might rexamine this soon.