Once, I had a not-so-brief flirtation with Neurosurgery. In medical school, I was awed by the structural and functional specificity of the brain, and fascinated by the almost priestly status of the neurosurgery attendings. Unlike other attendings, they did EVERYTHING themselves – from operating to NICU management (including respirators) to clinics to research. The gung-ho spirit of the specialty is infectious to those it speaks to – which is good because Neurosurgery demands a commitment so overwhelming it is more of a lifestyle choice than a profession. Unfortunately, my medical school did not have a top-ranked Neurosurgery program, so in my fourth year of medical school, it was up to the Mecca in Boston to steep myself in its culture. I was a curiosity, but the department was professionally committed to my education, which I appreciated. Daily rounds were done with different attendings as I tried to soak up as much as possible so that I could learn how to be a great, academic neurosurgeon.
One night, after a long day of operative procedures and clinics which started at 6am, I was rounding alone with the patriarch of the Neurosurgery department. This man was one of the greats – a society chairman, an expert in an esoteric and challenging area of neurosurgery, a prolific paper and book writer – a man who had dedicated his life to the pursuit of knowledge and surgical skill as a penultimate goal in his 60+ years of life. I was honored that he allowed me to round with him, in truth.
We were seeing the last patient of the day – late at night. It was a woman who had come to him with a brain tumor deemed inoperable by all others. The surgeon had taken her to the OR a few days ago, and tried to wrest the cancer from her brainstem. He proceeded painstakingly, with extreme care. The movements of his hands were precise and slight during the operation. Every time he tried to extirpate the tumor, it caused physiologic instability. It was nerve-wracking to observe. After a number of hours, he closed.
The patient was awake and awaiting the surgeon. She asked him, “Did you get it?” He answered, “No.” She then asked, “Am I going to die?” He answered softly, “Yes.”
The patient started to cry. And then I saw this man, this giant, this scientist and clinician beyond reproach – sit down on the bed and put his arm around the patient. He held her until she stopped crying. It was more than a perfunctory few minutes.
This man, at the pinnacle of his field, could act any way he wanted. He could spin on his heel and leave the room, snap at the patient and tell her to get herself together – and nobody would ever reproach him. Such a gifted surgeon could act any way he wished.
But instead he reached out in a more compassionate way to a suffering patient than many physicians I have known. It was not just programmed, scripted ‘compassion’ learned from a patient experience consultant – he waited there until she had exhausted her grief at that moment. She knew that he was there for her in a human, healing way, now that he could no longer cure her. I stood still, listening to her muffled sobs for at least 15 minutes.
The lesson learned – if the best of the best could show such compassion, so could I. Perhaps other surgeon’s responses I had seen lacking empathy were really a marker of a lesser degree of competence, a cover-up for personal or professional inadequacies instead of a mark of importance.
I ultimately did not choose Neurosurgery as my specialty. But the lesson stayed with me. I hope that in my practice I was able to show this degree of caring to my patients, many of whom came to me in extreme sickness, many of whom I would never be able to cure. I hope that I was able to heal them in some way.
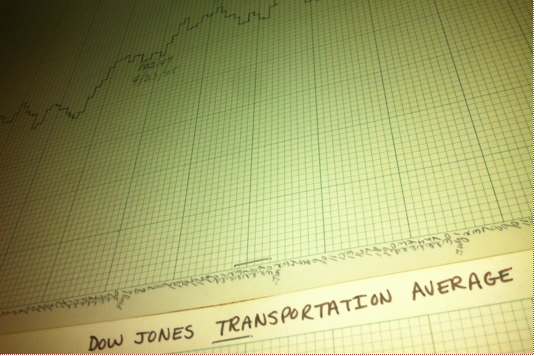
As might be expected with many years passage, he is now gone. But the picture of him is how I remember him, and I will share it with you. (from the MGH dept. of Neurosurgery web site)
If you missed the first part, read it here. Note: For the HIT crowd reading this, I’ll offer (rough) comparison to the HIMSS stages (1-7).
1. Descriptive Analytics based upon historical data.
Hand Drawn Chart of the Dow Jones Average
This was the most basic use of data analysis. When newspapers printed price data (Open-High-Low-Close or OHLC), that data could be charted (on graph paper!) and interpreted using basic technical analysis, which was mostly lines drawn upon the chart. (1) Simple formulas such as year-over-year (YOY) percentage returns could be calculated by hand. This information was merely descriptive and had no bearing upon future events. To get information into a computer required data entry by hand, and operator errors could throw off the accuracy of your data. Computers lived in the accounting department, with the data being used to record position and profit and loss (P&L). At month’s end a large run of data would produce a computer-generated accounting statement. A good analogue to this system would be older laboratory reporting systems where laboratory test values were sent to a dedicated lab computer. If the test equipment interfaced with the computer (via IEEE-488 & RS-232 interfaces) the values were sent automatically. If not, data entry clerks had to enter these values. Once in the system, data could be accessed by terminals throughout the hospital. Normal ranges were typically included, with an asterisk indicating the value was abnormal. The computer database would be updated once a day (end of day type data). For more rapid results, you would have to go to the lab yourself and ask. On the operations side, a Lotus 1-2-3 spreadsheet on the finance team’s computer of quarterly charges, accounts receivable, and perhaps a few very basic metrics would be available to the finance department and CEO for periodic review. For years, this delayed, descriptive data was the standard. Any inference would be provided by humans alone, who connected the dots. A rough equivalent would be HIMSS stage 0-1.
2. Improvements in graphics, computing speed, storage, connectivity.
Improvements in processing speed & power (after Moore’s Law), cheapening memory and storage prices, and improved device connectivity resulted in more readily available data. Near real-time price data was available, but relatively expensive ($400 per month or more per exchange with dedicated hardware necessary for receipt – a full vendor package could readily run thousands of dollars a month from a low cost competitior, and much more if you were a full service institution). An IBM PC XT of enough computing power & storage ($3000) could now chart this data. The studies that Ed Seykota ran on weekends would run on the PC – but analysis was still manual. The trader would have to sort through hundreds of ‘runs’ of the data to find the combination of parameters which led to the most profitable (successful) strategies, and then apply them to the market going forward. More complex statistics could be calculated – such as Sharpe Ratios, CAGR, and maximum drawdown – and these were developed and diffused over time into wider usage. Complex financial products such as options could now be priced more accurately in near-real time with algorithmic advances (such as the binomial pricing model). The health care corollary would be in-house early electronic record systems tied in to the hospital’s billing system. Some patient data was present, but in siloed databases with limited connectivity. To actually use the data you would ask IT for a data dump which would then be uploaded into Excel for basic analysis. Data would come from different systems and combining it was challenging. Because of the difficulty in curating the data (think massive spreadsheets with pivot tables), this could be a full-time job for an analyst or team of analysts, and careful selection of what data was being followed and what was discarded would need to be considered, a priori. The quality of the analysis improved, but was still human labor intensive, particularly because of large data sets & difficulty in collecting the information. For analytic tools think Excel by Microsoft or Minitab. This corresponds to HIMSS stage 2-3.
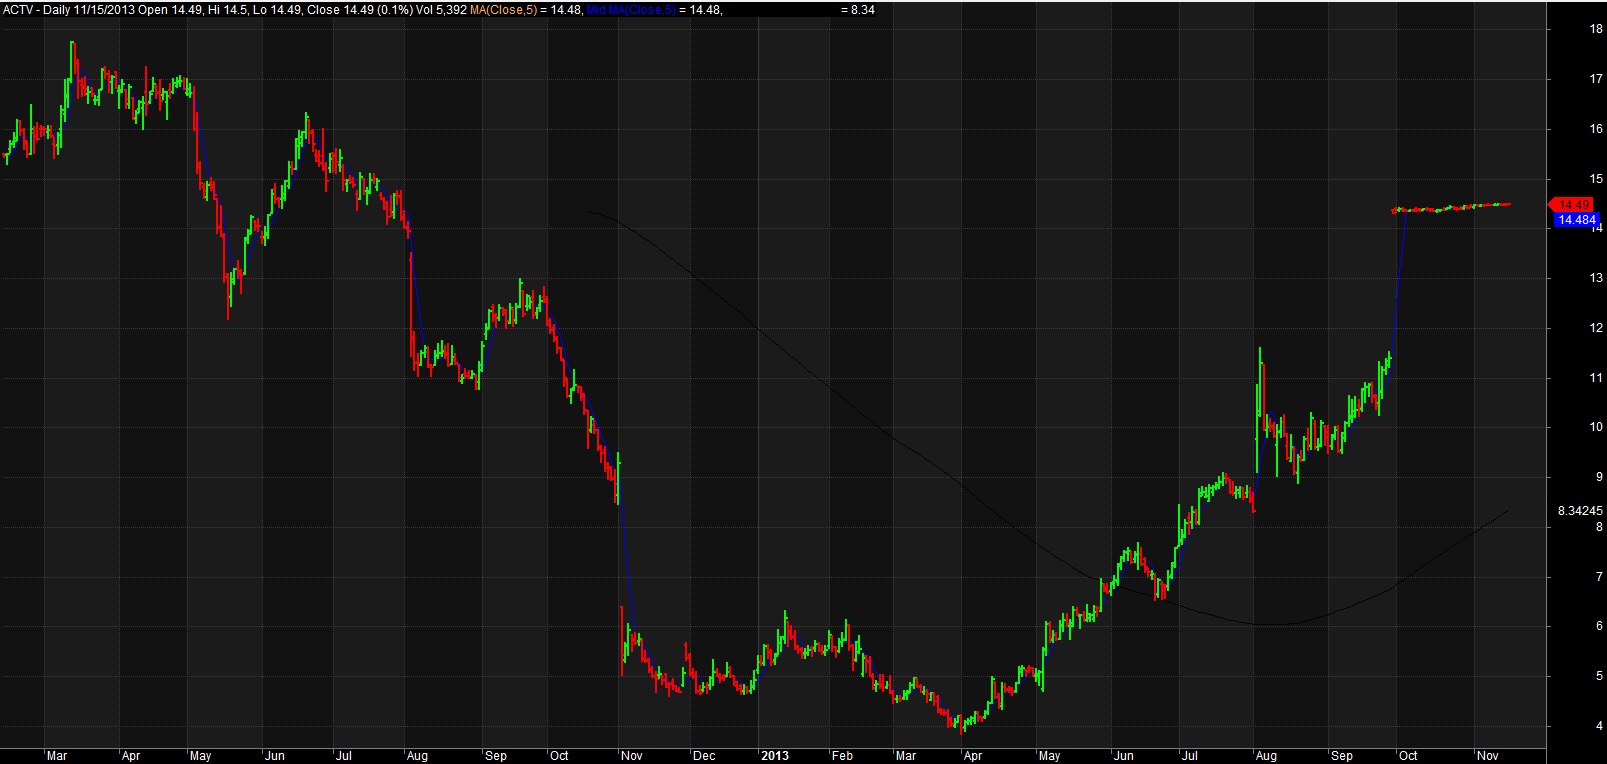
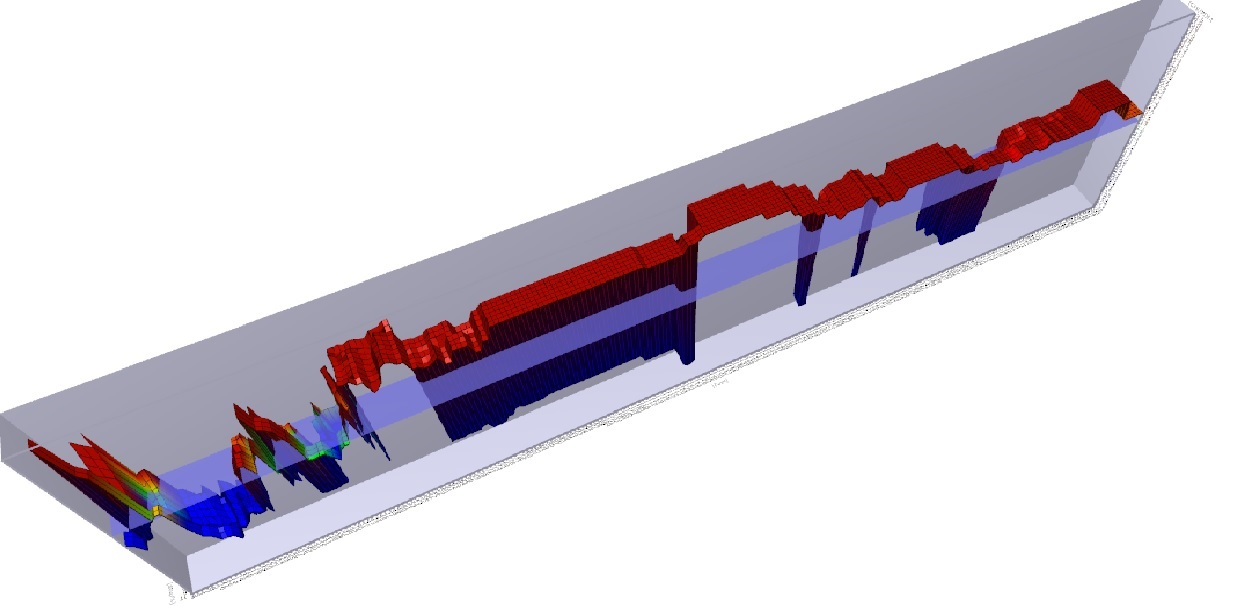
3. Further improvement in technology correlates with algorithmic improvement. With new levels of computing power, analysis of data became quick and relatively cheap allowing automated analysis. Taking the same data set of computed results from price/time data that was analyzed by hand before; now apply an automated algorithm to run through ALL possible combinations of included parameters. This is brute-force optimization. The best solve for the data set is found, and a trader is more confident that the model will be profitable going forward. For example, consider ACTV(2). Running a brute force optimization on this security with a moving average over the last 2 years yields a profitable trading strategy that returns 117% with the ideal solve. Well, on paper that looks great. What could be done to make it even MORE profitable? Perhaps you could add a stop loss. Do another optimization and theoretical return increases. Want more? Sure. Change the indicator and re-optimize. Now your hypothetical return soars. Why would you ever want to do anything else? (3,4) But it’s not as easy as it sounds. The best of the optimized models would work for a while, and then stop. The worst would immediately diverge and lose money from day 1 – never recovering. Most importantly : what did we learn from this experience? We learned that how the models were developed mattered. And to understand this, we need to go into a bit of math. Looking at security prices, you can model (approximate) the price activity as a function, F(X)= the squiggles of a chart. The model can be as complex or simple as desired. Above, we start with a simple model (the moving average), and make it progressively more complex adding additional rules and conditions. As we do so, the accuracy of the model increases, so the profitability increases as well. However, as we increase the accuracy of the model, we use up degrees of freedom, making the model more rigid and less resilient. Hence the system trader’s curse – everything works great on paper, but when applied to the market, the more complex the rules, and the less robustly the data is tested, the more likely the system will fail due to a phenomenon known as over-fitting.Take a look at the 3D graph below which shows a profitability model of the above analysis: You will note that there is a spike in profitability using a 5 day moving average at the left of the graph, but profitability sharply falls off after that, rises a bit, and then craters. There is a much broader plateau of profitability in the middle of the graph, where many values are consistently and similarly profitable. Changes in market conditions could quickly invalidate the more profitable 5 day moving average model, but a model with a value chosen in the middle of the chart might be more consistently profitable over time. While more evaluation would need to be done, the less profitable (but still profitable) model is said to be more ‘Robust’.
To combat this, better statistical sampling methods were utilized, namely cross-validation where an in-sample set is used to test an out-of-sample set for performance. This gave a system which was less prone to immediate failure, i.e. more robust. A balance between profitability and robustness can be struck, netting you the sweet spot in the Training vs. Test-set performance curve I’ve posted before. So why didn’t everyone do this? Quick answer: they did. And by everyone analyzing the same data set of end-of-day historical price data in the same way, many people began to reach the same conclusions as each other. This created an ‘observer effect’ where you had to be first to market to execute your strategy, or trade in a market that was liquid enough (think the S&P 500 index) that the impact of your trade (if you were a small enough trader – doesn’t work for a large institutional trader) would not affect the price. Classic case of ‘the early bird gets the worm’. The important point is that WE ARE HERE in healthcare. We have moderately complex computer systems that have been implemented largely due to Meaningful Use concerns, bringing us to between HIMSS stages 4-7. We are beginning to use the back ends of computer systems to interface with analytic engines for useful descriptive analytics that can be used to inform business and clinical care decisions. While this data is still largely descriptive, some attempts at predictive analytics have been made. These are largely proprietary (trade secrets) but I have seen some vendors beginning to offer proprietary models to the healthcare community (hospitals, insurers, related entities) which aim at predictive analytics. I don’t have specific knowledge of the methods used to create these analytics, but after the experience of Wall Street, I’m pretty certain that a number of them are going to fall into the overfitting trap. There are other, more complex reasons why these predictive analytics might not work (and conversely, good reasons why they may), which I’ll cover in future posts. One final point – application of predictive analytics to healthcare will succeed in the area where it fails on Wall Street for a specific reason. On Wall Street, the relationship once discovered and exploited causes the relationship to disappear. That is the nature of arbitrage – market forces reduce arbitrage opportunities since they represent ‘free money’ and once enough people are doing it, it is no longer profitable. However, biological organisms don’t response to gaming the system in that manner. For a conclusive diagnosis, there may exist an efficacious treatment that is consistently reproducible. In other words, for a particular condition in a particular patient with a particular set of characteristics (age, sex, demographics, disease processes, genetics) if accurately diagnosed and competently executed, we can expect a reproducible biologic response, optimally a total cure of the individual. And that reproducible response applies to processes present in the complex dynamic systems that comprise our healthcare delivery system. That is where the opportunity lies in applying predictive analytics to healthcare.
(1) Technical Analysis of Stock Trends, Edwards and Magee, 8th Edition, St. Lucie Press (2) ACTIVE Technologies, acquired (taken private) by Vista Equity Partners and delisted on 11/15/2013. You can’t trade this stock. (3) Head of Trading, First Chicago Bank, personal communication (4) Reminder – see the disclaimer for this blog! And if you think you are going to apply this particular technique to the markets to be the next George Soros, I’ve got a piece of the Brooklyn Bridge to sell you.
We, in healthcare, lag in computing technology and sophistication vs. other fields. The standard excuses given are: healthcare is just too complicated, doctors and staff won’t accept new ways of doing things, everything is fine as it is, etc… But we are shifting to a new high-tech paradigm in healthcare, with ubiquitous computing supplanting or replacing traditional care delivery models. Medicine has a ‘deep moat’ – both regulatory and through educational barriers to entry. However, the same was said of the specialized skill sets of the financial industry. Wall St. has pared its staffing down and has automated many jobs & continues to do so. More product (money) is being handled by fewer people than before, an increase in real productivity.
Computing power in the 1960’s-1970’s on Wall street was large mainframe & mini-frame systems which were used for back-office operations. Most traders operated by ‘seat of your pants’ hunches and guesses, longer term macro-economic plays, or using their privileged position as market-makers to make frequent small profits. One of the first traders to use computing was Ed Seykota, who applied Richard Donchian’s trend following techniques to the commodity markets. Ed would run computer programs on an IBM 360 on weekends, and over six months tested four systems with variations (100 combinations), ultimately developing an exponential moving average trading system that would turn a $5000 account into $15,000,000.(1) Ed would run his program and wait for the output. He would then manually select the best system for his needs (usually most profitable). He had access to delayed, descriptive data which required his analysis for a decision.
In the 1980’s – 1990’s computing power increased with the PC, and text-only displays evolved to graphical displays. Systems traders became some of the most profitable traders in large firms. Future decisions were being made on historical data (early predictive analytics). On balance well-designed systems traded by experienced traders were successful more often than not. Testing was faster, but still not fast (a single security run on a x386 IBM PC would take about 8 hours). As more traders began to use the same systems, the systems worked less well. This was due to an ‘observer effect’., with traders trying to exploit a particular advantage quickly causing the advantage to disappear! The system trader’s ‘edge’ or profitability was constantly declining, and new markets or circumstances were sought. ‘Program’ trades were accused of being the cause of the 1987 stock market crash.
There were some notable failures in market analysis – Fast Fourier Transformations being one. With enough computing power, you could fit a FFT to the market perfectly – but it would hardly ever work going forward. The FFT fails because it presumes a cyclical formula, and the markets while cyclical, are not predictably so. But an interesting phenomenon was that the better the fit in the FFT, the quicker and worse it would fall apart. That was due to the phenomenon of curve-fitting. ‘Fractals’ were all the rage later & failed just as miserably – same problem. As an aside, it explains why simpler linear models in regression analysis are frequently ‘better’ than a high-n polynomial spline fit to the data, particularly when considered for predictive analytics. The closer you fit the data, the less robust the model becomes and more prone to real-world failure.
Further advances in computing and computational statistics followed in the 1990’s-2000’s. Accurate real-time market data became widely available and institutionally ubiquitous, and time frames became shorter and shorter. Programs running on daily data were switched to multi-hour, hour, and then in intervals of minutes.The trend-following programs of the past became failures as the market became more choppy, and anti-trend (mean reversion) systems were popular. Enter the quants – the statisticians.(2) With fast, cheap, near-ubiquitous computing, the scope of the systems expanded. Now many securities could be analyzed at once, and imbalances exploited. Hence the popularity of ‘pairs’ trading. Real-time calculation of indices created index arbitrage, which were able to execute without human intervention.
The index arbitrage (index-arb) programs relied on speed and proximity to the exchanges to have advantages in execution. Statistical Arbitrage (Stat-arb) programs were the next development. These evolved into today’s High-Frequency-Trading programs (HFT’s) which dominate systems trading These programs are tested extensively on existing data, and then are let loose on the markets to be run – with only high-level oversight. They make thousands of trading decisions a second, incur real profits and losses, and compete against other HFT algorithms in a darwinian environment where the winners make money and are adapted further, and the losers dismissed with a digital death. Master governing algorithms coordinate individual algorithms. (4)
The floor traders, specialists, market-makers, and scores of support staff that once participated in the daily business have been replaced by glowing boxes sitting in a server rack next to the exchange.
Not to say that automated trading algorithms are perfect. A rogue algorithm with insufficient oversight caused a forced sale of Knight Capital Group (KCG) in 2012. (3) The lesson here is significant – there ARE going to be errors once automated algorithms are in greater use – it is inevitable.
So reviewing the history, what happened on wall st.? 1. First was descriptive analytics based upon historical data. 2. Graphical Interfaces were improved. 3. Improving technology led to more complicated algorithms which overfit the data. (WE ARE HERE) 4. Improving data accuracy led to real-time analytics. 5. Real time analytics led to shorter analysis timeframes 6. Shorter analysis timeframes led to dedicated trading algorithms operating with only human supervision 7. Master algorithms were created to coordinate the efforts of individual trading algorithms.
Next post, I’ll show the corollaries in health care and use it to predict where we are going.
There is a widely held belief, perhaps unspoken but no less strongly held, that the healthcare business is a zero-sum game.
Consider how healthcare dollars are generated. A hospital system, care facility, or provider provides a service to the surrounding area, termed a catchment area. Those covered lives in the catchment are expected to generate a certain amount of healthcare expenditures on an aggregate, population basis. This is modeled by insurers and hospital systems for budgetary purposes. Given the number of people in the catchment area, the age, socio-economic status, general degree of illness, and type of insurance, finance professionals and actuaries can make an estimate of expected healthcare dollars by payors (insurers, government) to providers and facilities on a per patient basis.
While modifiers, complications, and co-morbidities can alter the real billing for a particular patient and encounter, on aggregate most in the healthcare industry tend to think that these care dollars will either be captured by their system or a competitor. Hence, zero-sum. That understanding probably accounts for the ‘me too’ effect in healthcare, as once one system purchases a gamma knife, the other system will to, as they are unwilling to let the competitor capture those lives with the resulting profit strengthening one system over the other.
But this zero-sum mentality trickles down as well from the CEO level to employees, particularly middle management. Consider the service line manager – given a fixed budget, bonused on cost savings vs that budget ceiling. You have value-added services that earn revenue. However, you also have compliance-related non-value add mandatory services which are essentially costs. What’s one way to improve the service line budget? By keeping the valued added work and pawning off the non-value added work as much as possible on someone else. By having your clinicians bill separately for services, and requiring by medical staff privileges that ‘cherry picking’ is not allowed, you make sure your clinicians will provide services to the indigent as well as the insured. But you don’t have to pay your clinicians for that work. By requiring department chairpeople to design standard orders, you avoid having to hire consultants to do the same thing. Cost-shifting onto the non-employed physician is a well-known phenomenon. Don’t think that it doesn’t work the other way, however! On a busy friday afternoon, a family practitioner sends a complicated elderly patient to the ER with a weak complaint which requires evaluation. When it is time to discharge the patient, the family members can’t be found and the physician, who does not have privileges at the hospital, won’t answer the phone. An economist would argue that each of these individuals acted in their own best interest, but the cost to the patient and the system, as well as the payor, is high.
As physicians are employed in the hospital system, the situation gets more complex. Cost-shifting behavior dies slowly, but the mid-level administrator is merely shifting costs within the system to another service line manager to meet their own budgetary or productivity goals. Without an institutional understanding of why this behavior is maladaptive, and management processes in place to make sure this does not happen, the result is that employed physician is cost shifted upon – and that person has lost the ability to cost-shift herself back to maintain equilibrium by virtue of employment. This is a problem, because it can cause physician dissatisfaction, a declining quality of care, and ultimately physician burnout. And currently, there does not seem to be any governance model in place to prevent this (At least, I’m unaware of them). What will ultimately happen is service lines will be missing key players, resulting in missed revenue opportunities for the system – essentially giving their competition the edge – in light of positive budgets and productivity goals. This will leave most executives scratching their heads, as the relationship is not directly seen. The bottom line is that you can’t cost shift onto yourself. Systems employing physicians in significant numbers would be wise to learn this quickly.
I hope it is clear to anyone reading this blog that this is a terrible waste of human capital.
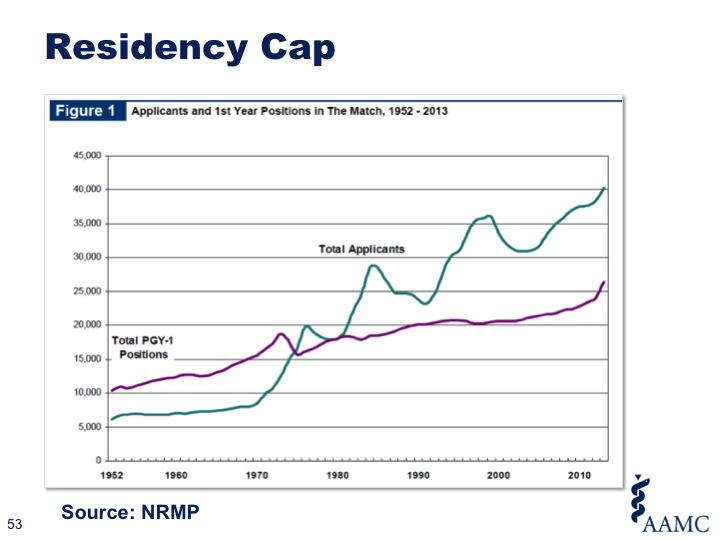
If it becomes widely known that you need to spend $320,000 on four years of medical school just to compete for a shot at a residency, the ‘best and brightest’ will take one look at that, say “No thank you” and re-orient to careers that do not subject them to an inordinate degree of personal and professional risk. Medical students will then be picked from 1) the truly wealthy, 2) the uninformed, and 3) the desperate, looking for a lottery ticket.
I am mentoring a young physician who falls into that gap and has been unable to secure an internship. Once upon a time, this physician would have slid readily into a less competitive specialty – pediatrics, family practice, etc… But now, their ability to practice medicine in the future is really in jeopardy. This is a bright person with an ivy-league background and a winning personality, but coming from a lower-tier medical school. Their dream of being a physician is at risk of becoming a nightmare. And the terrible thing is that this individual’s story is not a fluke any more. The terrible state of Graduate Medical Education (GME) in the United States needs to be addressed.
P.S. Any program directors needing to fill a slot with a great intern, contact me.
Let’s think about provider productivity. As an armchair economist, I apologize to any PhD economists who feel I am oversimplifying things.
Why is productivity good? It has enabled the standard of living increase over the last 200 years. Economic output is tied to two variables: the number of individuals producing goods, and how many goods and services they can produce – productivity. Technology supercharges productivity. 50 member platform companies now outproduce the corporation of 40 years ago which took a small army of people to achieve a lower output. We live better lives because of productivity.
We strive for productivity in health care. More patients seen per hour, more patients treated. Simple enough. But productivity focused on N(#) of patients seen per hour does not necessarily maintain quality of care as that metric increases. A study of back office workers in banking validated that when the workers were overloaded, they sped up, but the quality of their work decreased (defects). Banking is not healthcare, granted, but in finance defects are pretty quickly recognized and corrected [“Excuse me, but where is my money?”]. As to patient outcome, defects may take longer to show up and be more difficult to attribute to any one factor. Providers usually have a differential diagnosis for their patient’s presenting complaints. A careful review of the history and medical record can significantly narrow the differential. Physician extenders can allow providers to see patients more effectively, with routine care shunted to the extender. However, for a harried clinician, testing can also be used as a physician extender of sorts. It increases diagnostic accuracy, at a cost to the patient (monetary and time) and the payor (monetary). It is hardly fraudulent. However, is it waste? And since it usually requires a repeat visit, is it rework? Possibly yes, to both.
The six-minute per encounter clinician who uses testing as a physician extender will likely have higher RVU production than one who diligently reviews the medical record for a half-an-hour and sees only 10 patients a day. But who is providing better care? If outcomes are evaluated, I would suspect that there is either no difference between the two or a slight outcome measure favoring the higher testing provider. An analysis to judge whether the cost/benefit ratio is justified would probably be necessary. Ultimately, if you account for all costs on the system, the provider that causes more defects, waste, and re-work is usually less efficient on aggregate, even though individually measured productivity may be high. See: ‘The measure is the metric‘. Right now, insurers are data mining to see which providers have best outcomes and lowest costs for specific disease processes, and will steer patients preferentially to them (Aetna CEO, keynote speech HIMSS 2014).
One of my real concerns is that we are training an entire generation of providers in this volume-oriented, RVU-production approach. These folks may be high performers now, but when the value shift comes, these providers are going to have to re-learn a whole new set of skills. More worrisome, there are entire practices that are being optimized under six sigma processes for greatest productivity. Such a practice will have a real problem adapting to value-based care, because it represents a cultural shift. It might affect the ability of a health system to pivot from volume to value, with resulting loss of competitiveness.
In the volume to value world, there are two types of productivity:
Fake productivity: High RVU generators who do so by cost shifting, waste, re-work, defects.
True productivity: Consistent RVU generators who follow efficient testing, appropriate # of follow-up visits, and have the good outcomes to prove it.
I am sure that most providers want to work in the space of real productivity – after all, it represents the ideal model learned as students. Fake productivity is simply a maladaptive response to external pressures, and shouldn’t be conflated with True productivity.
Browsing the other day I came across a question asking about salary metrics. A multi-specialty group (MSG) was looking at a sale to a hospital. All providers were on flat salary. (uh oh) Paying everyone a flat salary in a single specialty group (SSG) communicates that you are being paid for your time, not necessarily productivity. This may work in some models (dept. of health clinics, clinics targeting the underserved, etc…) but in a SSG with multiple physicians, it will eventually cause problems as 1) different physicians have different productivity naturally and 2) paying a flat salary regardless of income is fiscally dangerous – you can’t spend more than you earn. This approach may flatten productivity in a ‘lowest common denominator effect’.
At the other extreme, is ‘eat what you kill’. This creates a vicious practice environment where partners fight over high RVU & highly paid work, and ‘dump’ the unpaid or poorly paid work on each other, other clinicians, anyone they can! Younger, less connected members of the group are taken advantage of by older, savvier partners. This kind of practice (and they do exist!) is where medicine gets its reputation of “eating its young.” It is an anti-collegial system, and results in high turnover, a lower level of overall care, possible legal risk, and ultimately a lawsuit when the providers split up.
So, how to resolve this problem?
1. Its important that you KNOW your provider’s productivity. How many RVU’s? How many patients seen? How many procedures? What are their charges? What are their receivables? You need to measure these items. Billing records may give a reasonable approximation. Consider basing productivity on charges, not revenue, as different payor mixes may have different reimbursement, and swapping a provider to another site/shift might account for differences in recovered revenue. Also see discussion below in #3 for philosophy.
2. Once you know the average productivity of the providers, then you can establish the level of salary from MGMA for a group of that % of productivity. Consider establishing the base salary at a slightly lower level (i.e. if average group productivity is 65%tile – 85%tile, set your base salary at the 65th%tile not the 75th%tile mean) so that less productive members of the group are not dismissed at the first opportunity if they are not meeting productivity measures. In a MSG setting, it might be better to treat it as a bunch of single specialty group contracts negotiated under a master agreement.
3. Establish a bonus based upon excess RVU’s to encourage productivity. Be careful here, as solely basing the bonus on RVU’s can cause the group to lose cohesiveness and collegiality. Even better, if you can model it correctly, use a hybrid model of RVU’s, # of patients seen, total $ amount of charges. This last part is important, as one of the big advantages of being a hospital-owned group is the ability to be separated (in theory) from accounts receivable. Bottom line – providers are doing the work, and the hospital is doing the collection. You (the providers) need to be paid for your work & the hospital needs to collect. If the hospital is not able to collect, that is beyond your ability to control in a hospital-owned practice, and ultimately not your responsibility (although you must do everything in your power to help them collect by coding properly & compliantly). It is a shift in thinking from shareholder to employee. One neat thing that you can do here as a MSG is set a ‘group bonus’ tied to the overall productivity of EVERYONE now in the MSG swept into the hospital group and a separate ‘individual bonus’. That might go a long way to maintain the culture which existed in the MSG and keep the providers happier.
4. Nobody likes to do work that they are not paid for. So for administrative duties (chairmanships, committees, etc…) negotiate a small(er) bonus for that specific work.
5. There are quality measures that need to be met under meaningful use criteria, and the hospital leadership may have set their own performance measures. There should be a small bonus for meeting these measures as well as a small demerit for not meeting them. (+/- 0-2%?) This should modify the overall group and individual productivity bonus to discourage folks from boosting RVU’s at the expense of quality measures.
6. For call, you might be wise to negotiate a flat rate per call with the hospital (specialty-specific). That way, those who hate call can ‘sell’ their call to those who like to take call or who are hungrier for earnings. If you do so, you MAY need to hold the call earnings out of the RVU pool as otherwise those who take more call will have more RVU’s and skew the bonus pool. However, the calculation may be difficult to do.
7. Finally, once you go through this process you can standardize a day’s pay, and those who want to work less can buy vacation days from those who want to work more. This is a nice option if available.
8. Be really clear about the metrics established for performance evaluation, promotion, and bonuses. Try to make it fair but don’t provide incentives for uncollegial behavior, substandard care, etc… It will save money and heartache later. See previous post on “The measure is the metric.” Solely basing employment on RVU targets is risky.
Z.B. While I think its fine to ask on the net about options, there is no substitute for specific, expert advice from someone who has gone through this process before – preferably multiple times! Being that a MSG has the income of multiple physicians, I think that it would be wise for them to hire a consultant who has guided groups through this kind of transition and can evaluate the practice intimately under a NDA and provide specific recommendations (which this post is emphatically NOT). Perhaps the questions and comments above may serve as a very rough beginning of a process which will lead to a successful cash-out and transition from private practice to hospital-owned practice.
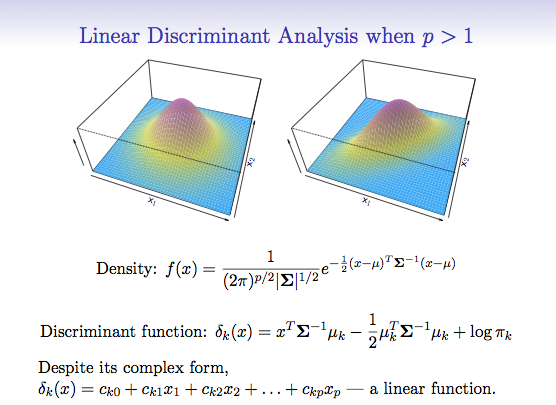
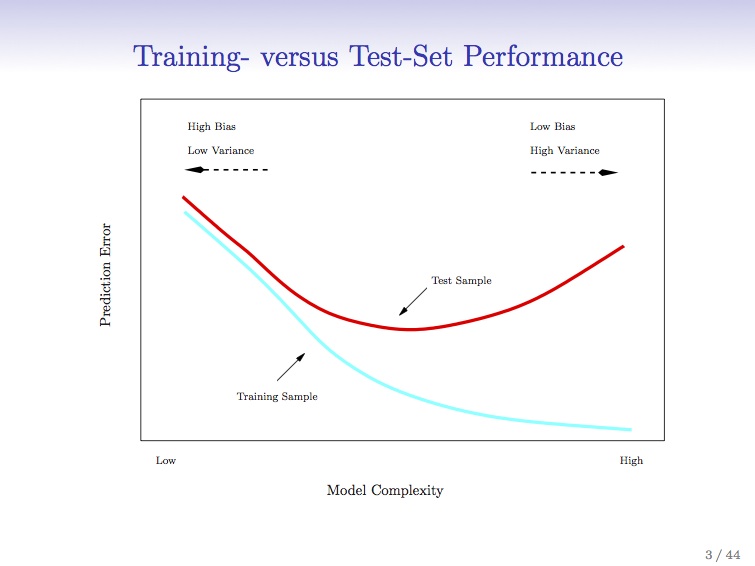
I’m taking Trevor Hastie’s and Robert Tibshirani’s fantastic Statistical Learning course online through Stanford. The slide here is great – and shows the danger of complex models and overfitting. For the data scientists – cross validation. If any system traders or finance people are reading, think walk-forward analysis.
Basically, what the graph says is that when you apply a better and better model with higher levels of refinement to your system, you ‘fit’ your established data more accurately. However, because the system is more complex, it is more rigid and less flexible (degrees of freedom, anyone?) and less resilient. Tracks the data better, but works less well in practice. That’s why the red line starts going up again as the scale of complexity goes from low to high. Does this resonate with any of the process improvement (PI) people who are six-sigma trained? Once you scoop up the low-hanging fruit and pass that first or second sigma in iteration, things get tougher. A lot tougher.
This is the trap of curve-fitting (also known as overfitting). More in this case is less, as the model fails to be predictive.
Where I’m going in this blog is to integrate some of these concepts with resource allocation problems in healthcare; and their resulting effect on patient care. I’m particularly interested in applying these techniques to predictive analytics in healthcare. I think we can learn a great deal from the practical applications of these computational statistic tools which have been successfully applied (I know because I started my career doing it) to the markets on Wall St. What medicine can learn from Wall St. is a topic I intend to cover in a series of posts. But healthcare is not the markets, and can’t be approached entirely similarly. The costs of error are catastrophic in terms of lives – it’s not just about money.
I hope you stay with me as I develop this theme.
Image from :https://class.stanford.edu/courses/HumanitiesScience/StatLearning/Winter2014/about
This is a post from a person I interact with on social media. It has been heavily modified to keep anonymity. I have obtained express consent from this person to share their views here.
Dear Dr. — Thanks for seeing my child today & conducting a comprehensive exam. We were pleased with your care & the recommendations received.
However, please work with your staff on:
1 -Don’t tell me ‘1 hour’ if I ask how long the the appointment will last and then expect me to be happy after more than three. Yes – I do know I will have to wait – a range would be helpful.
2 – When called to reconfirm by your staff, I asked if they had all of our reports sent 2 months ago which were printed for you (it’s a little complicated). Don’t have them tell me ‘yes’ when the answer was ‘NO’. Putting a ‘see me’ post it note on the file from a staff member who is out of the office is not helpful.
3 – You are excellent in what you do. I’m happy to pay for your knowledge and expertise but not your data entry skills (see above).
4 – When I explain to your staff that my child is uncomfortable going to physician’s offices and I need to prepare him about what to expect, please don’t giggle. Is this the first time your staff has been asked this question? I can’t believe that.
Thank you.
Comments:
-A friend once sent a bill to his doctor for making him wait 3 hours.
-I hear you . Waiting forever is the worst! Some health professionals need to brush up on their interpersonal skills.
-(We) were just talking about the medical practitioners we’ve left over the years…because of their staff!!
-…staff was really frustrating. …tried to give feedback constructively and professionally but the attitude was unreal.
Can anyone not relate to this? (Unless you are a practicing physician or administrator and you are so busy you have no time to go to the doctor!) I view this as a systems failure. The processes to make sure that this patient had an excellent experience were not there – the Doctor seems to being doing all he can to make the experience great (except for the ubiquitous data-entry EMR curse that patients hate as much as physicians!), but the staff undermines his efforts and this visit goes squarely into the negative category. Regardless of where you want to place accountability (the staff, the physician, the office manager, the administrator), the root cause of this negative experience could be looked at and improved.
What the patient (patient’s parent/responsible party) wanted in this circumstance was:
Accurate scheduling (responsible booking, integration with MD’s calendar)
Accurate information (saying “you should block off your afternoon, but we will try to get you out in an hour” would go a long way here)
No data entry (hire a scribe or switch your EMR system!)
Transmissible Review of information by a staff member (no “see me” post-its – that’s poor continuity of care)
To be treated with respect and dignity (NO giggling or attitude).
The last item is the most concerning – I know that we are starting to recognize ‘compassion fatigue’ and ‘burnout’ in docs in increasing numbers, and it almost certainly crosses over to support staff. But this offending staff needs to be trained/educated, or shown the door. Someone else’s discomfort is never a cause for a healthcare staffer’s entertainment. Better to create systems and processes that rein in the chaos and allow these staffers to feel less besieged and give a level of care that supports the hard-working doctor’s efforts, not negates them.
I’m only getting started in learning about the mHealth community and applications. But from the (limited) amount I can gather about this somewhat distributed ecosystem, it seems to be this:
1. Lots of mHealth Apps out there. 2. Many designed without serious clinical input (i.e. mediocre or wrong information) 3. Many designed without attention to UI (user interface) or UX (user eXperience). 4. No connectivity to patient records = a failure of design. 5. Few real users.
That’s why we’re not seeing a ton of mHealth apps exploding on the marketplace and multiple IPO’s. Perhaps I’m being a bit harsh here, as we just might be early to the game. But the end result?
Problems: 1. No one wants to PAY for wellness. And more concerningly, there is no evidence that wellness works (1) 2. Poor UI/UX, as described above. 3. No integration into patient portals or hospital EHR’s for the majority of users. 4. Data from apps not readily available to providers. 5. No data from application to show that it is useful to clinicians.
Specifically targeting point #1 – aside from the motivated quantified health folks, how do we get the right app into the hands of the right people? From my point of view, a progressive vertically integrated system – insurer – hospital – provider all rolled up into one – could target (hotspot) an area of cost excess or refractoriness in meeting ratios or a MU requirement. Then, BUY the app & developers. INTEGRATE it into the systems EMR in a way that the providers feel is useful and that should give a triple aim result. Then DISTRIBUTE it to your hotspot in such a way that group members are motivated to use it & TRACK the results. Win-win for everyone.
At HIMSS 2014, the bulk of the discussion of mHealth was on mobile data management to meet HIPAA compliance. Sensible, but suggests that the critical mass for actual clinical applications is not there, despite recent FDA liberation of rules for health apps.
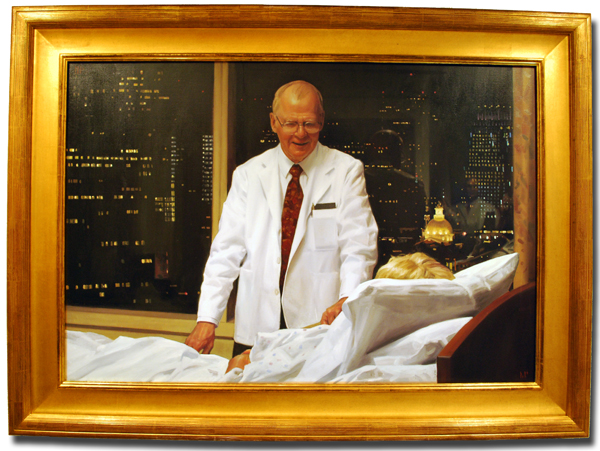 Good night, Dr. Ojemann. (1931-2010)